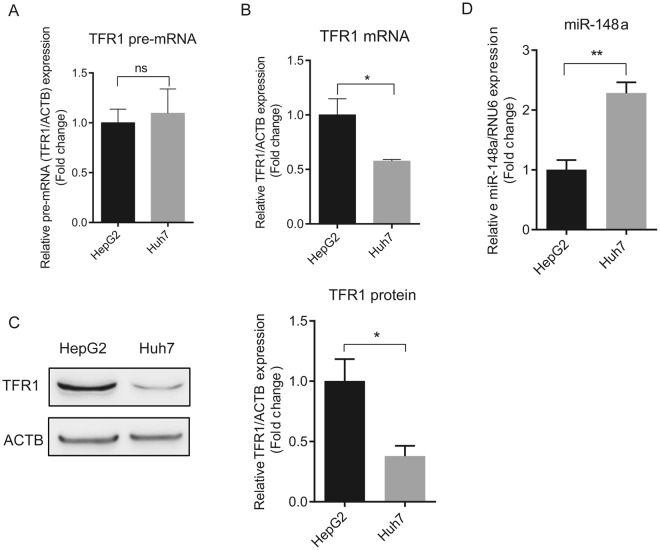
Figure 4.
TFR1 expression is negatively correlated to miR-148a levels in HCC cells. Two HCC cell lines were analyzed for the expression of TFR1 pre-mRNA and mRNA by qPCR. (A) Differences of TFR1 pre-mRNA levels were similar between HepG2 and Huh7 cells (P = 0.7475), while TFR1 mRNA (B) and protein (C) levels were significantly different. (D) miR-148a expression in the HepG2 and Huh7 cell lines. Experiments were performed in triplicates and repeated at least three times. Q-PCR data were normalized to appropriate reference genes: ACTB (A,B) or RNU6 (D). Representative western blots displayed in C are cropped from Fig. S6. Data are represented as mean ± SEM. ns = no statistical significance, *P < 0.05, **P < 0.01, 2-tailed Student’s t test.

