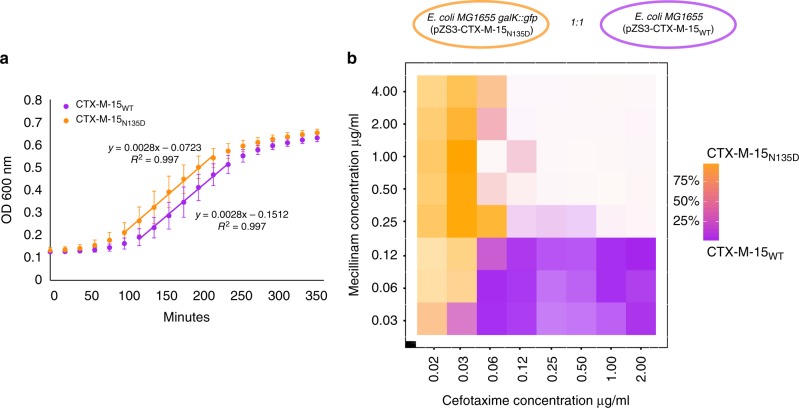
Fig. 3.
CTX-M-15WT vs. CTX-M-15N135D growth curves and 2D gradient plot. a E. coli TOP10 carrying either (pZS3-CTX-M-15WT) or (pZS3-CTX-M-15N135D) were grown in LB media in six biological replicates and growth rates were compared using linear regression on the exponential growth phase. No effect on the growth rate was observed for strains expression either enzyme in absence of antibiotic exposure. Error bars: SD. b E. coli MG1655 (pZS3-CTX-M-15WT) was mixed with E. coli MG1655 galK::gfp (pZS3-CTX-M-15N135D) in a 1:1 ratio and grown in a 2D gradient of mecillinam vs. cefotaxime. Each square represents a well and the colour represents the amount of either labelled CTX-M-15N135D (orange) or non-labelled CTX-M-15WT (purple). Darker colour indicates higher total cell count and lighter colour indicate lower cell count. The highest concentrations corresponded to mecillinam 4 × MIC for CTX-M-15WT and cefotaxime 2 × MIC for CTX-M-15N135D. At drug exposures above 0.06 μg/mL and 0.25 μg/mL of cefotaxime and mecilliam, respectively, neither strains expressing the CTX-M-15N135D or the CTX-M-15WT can survive

