
Figure 1.
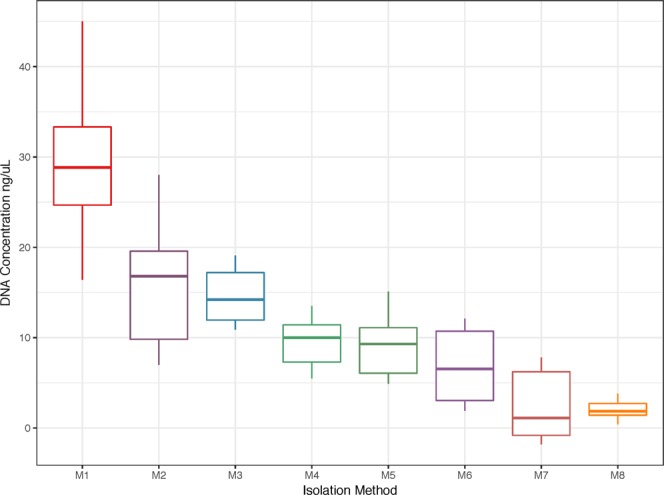
DNA Quantitation for each isolation method. DNA concentrations (ng/μl) of six oral samples were calculated after eight different DNA extraction methods described in Table 1 and corresponding to the categories shown on the x-axis. All methods used the same starting quantities of sample and final volumes were equal; concentrations are proportional to total DNA recovered. Statistical analyses of the differences in DNA amounts recovered are shown in Table 2.