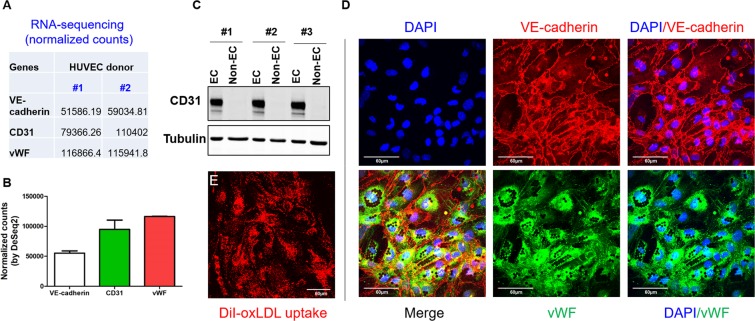
Figure 3.
Identification of cultured MLECs by western blot and confocal microscopy. (A,B) RNA-sequencing data mined from published literature19 shows expression abundance of three EC marker genes, VE-cadherin (also known as CDH5), CD31 (also known as PECAM1), and vWF. Data shown are normalized counts from two different donors of HUVECs. (C) CD31 expression of EC fraction (CD31+; ICAM2+) and non-EC (CD31−; ICAM2−) fraction after second bead sorting, n = 3 different mice. (D) VE-cadherin (red) and vWF (green) staining of cultured MLEC by confocal microscopy, n = 4, scale bar = 60 um. (E), DiI-oxLDL uptake (red) by cultured MLECs, n = 5, scale bar = 60 um.

