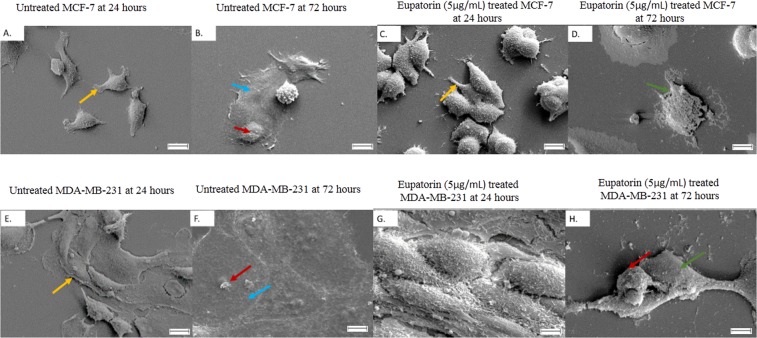
Figure 2.
Morphology changes in MCF-7 and MDA-MB-231 cells after eupatorin treatment at 72 hours were recorded using SEM. (A) untreated MCF-7 at 24 hours, (B) untreated MCF-7 at 72 hours, (C) eupatorin-treated MCF-7 cells at 24 hours and (D) eupatorin-treated MCF-7 cells (E) untreated MDA-MB-231 at 24 hours, (F) untreated MDA-MB-231 at 72 hours, (G) eupatorin-treated MDA-MB-231 cells at 24 hours and (H) eupatorin-treated MDA-MB-231 cells at 72 hours. Blue arrow ( ) indicated the membrane collapsed, green arrow (
 ) indicated complete loss of cells membrane, and red arrow (
 ) indicated shrunken cell and the absence of microvilli while yellow arrow (
 ) pointed at intact body of healthy cells. Magnification: x1000; scale bar: 10 μM.

