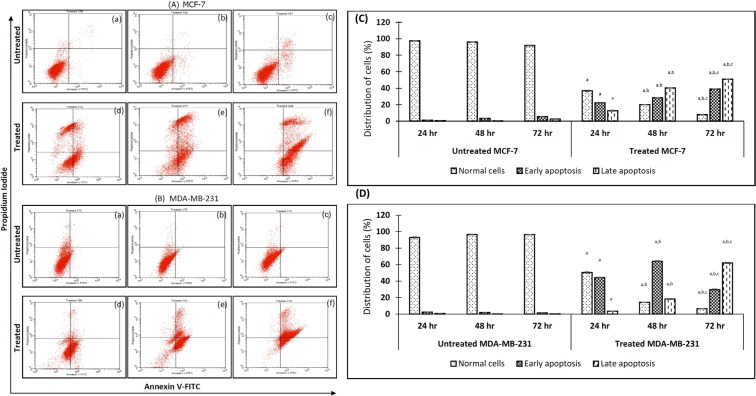
Figure 5.
Eupatorin-induced apoptosis in MCF-7 and MDA-MB-231 cells by AnnexinV-FITC/PI staining assay. The cells were treated with specific concentration of eupatorin for 24, 48 and 72 h. (A) Flow cytometry assay of eupatorin-induced apoptosis cells. (a) untreated for 24 h; (b) untreated for 48 h; (c) untreated for 72 h; (d) treatment with 5 μg/mL eupatorin for 24 h; (e) treatment with 5 μg/mL eupatorin for 48 h; (f) treatment with 5 μg/mL eupatorin for 72 h. (C and D) Columns show mean values of three experiments (±S.D.). (C) eupatorin induced apoptosis of MCF-7 and (D) eupatorin induced apoptosis in MDA-MB-231 cells. (aStatistical significance (p < 0.05) compared to the untreated for the respective time point, bstatistical significance (p < 0.05) compared to the treated group for 24 hours, cstatistical significance (p < 0.05) compared to the treated group for 48 hours).

