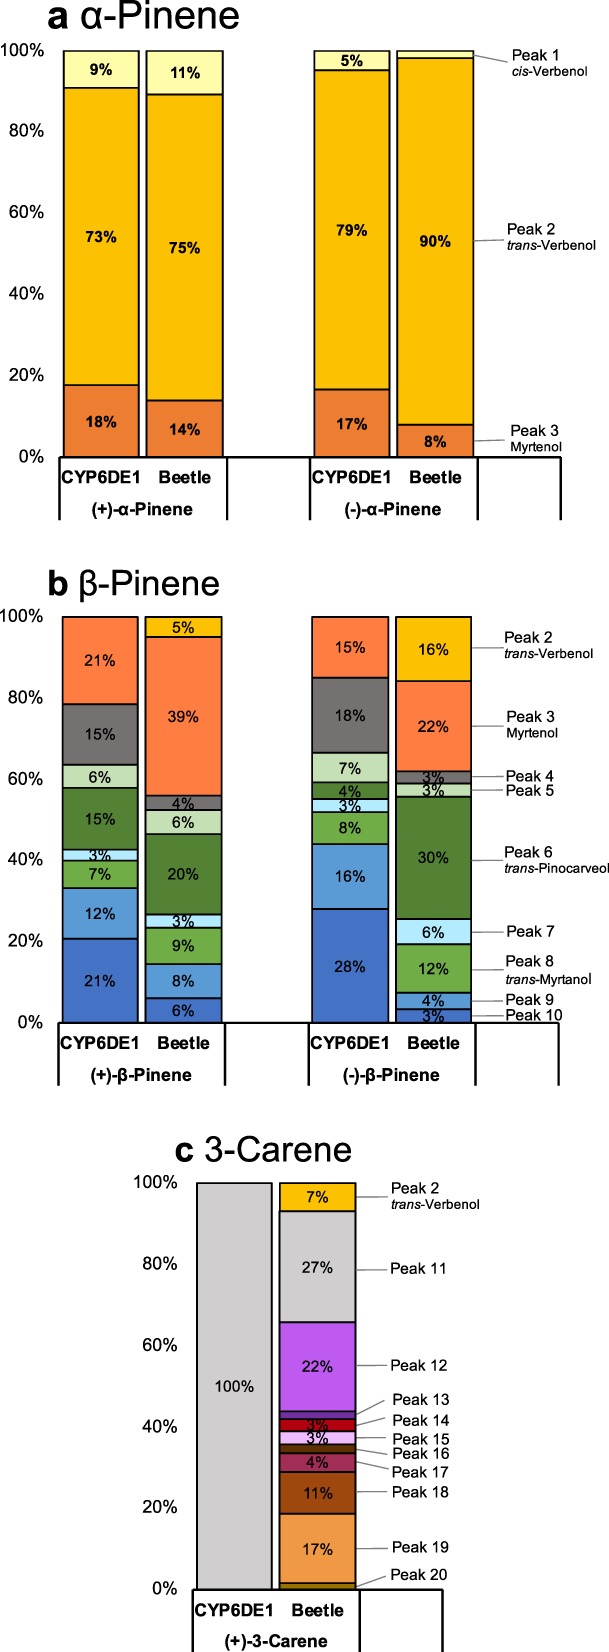
Figure 3.

Relative quantitative composition of products formed by CYP6DE1 in in vitro enzyme assays with different monoterpenes, and GC-MS traces of products extracted from female MPB exposed to different monoterpenes. (a) The percentage profile was calculated from total nanograms based upon response factors of authentic standards. (b,c) The percentage profile was calculated by peak area of the extracted ion chromatogram. Retention indices and mass spectra are shown in Supporting Table S2 and Supporting Figs S3–S7. CYP6DE1 assays were performed with N = 6 replicates; MPB treatment assay were performed with N = 4 replicates.
