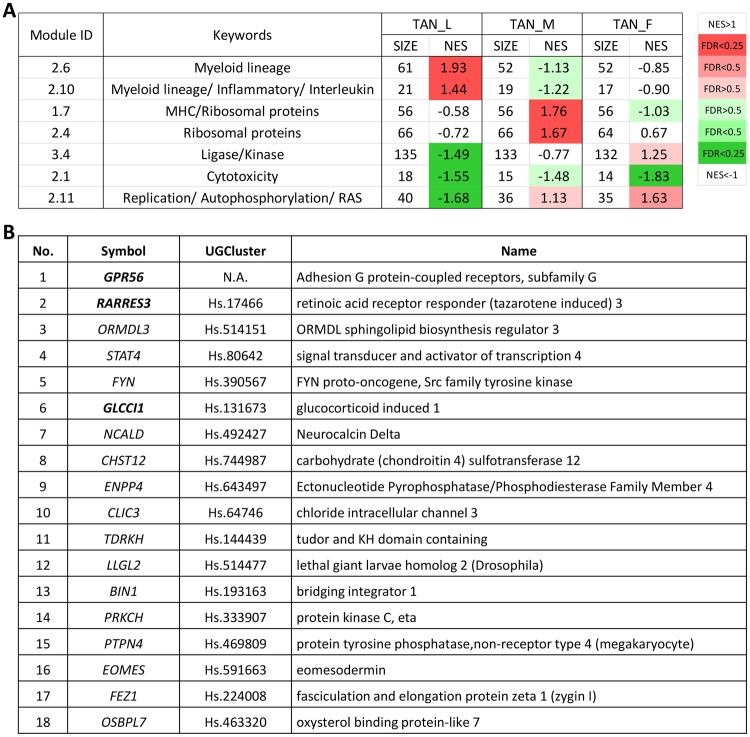
Figure 4.
Immune module analysis of TAN transcriptomes by GSEA. (A) List of enriched immune modules in TAN groups. Significant normalized enrichment scores (NES) are highlighted based on False Discovery Rates (FDR), which are shown in color as indicated by a color scale on the right. Red indicates positive values of NES and green indicates the negative values. FDR values below 0.25 are regarded as statistical significance. (B) List of leading edge genes in Module 2.1 Cytotoxicity. Gene No. 1–14 are common among all the TAN groups. No. 15 is common in TAN_L and TAN_M. No. 16–18 are only found in TAN_L. The bold highlighted genes are discussed in the paragraph. N.A., not available.

