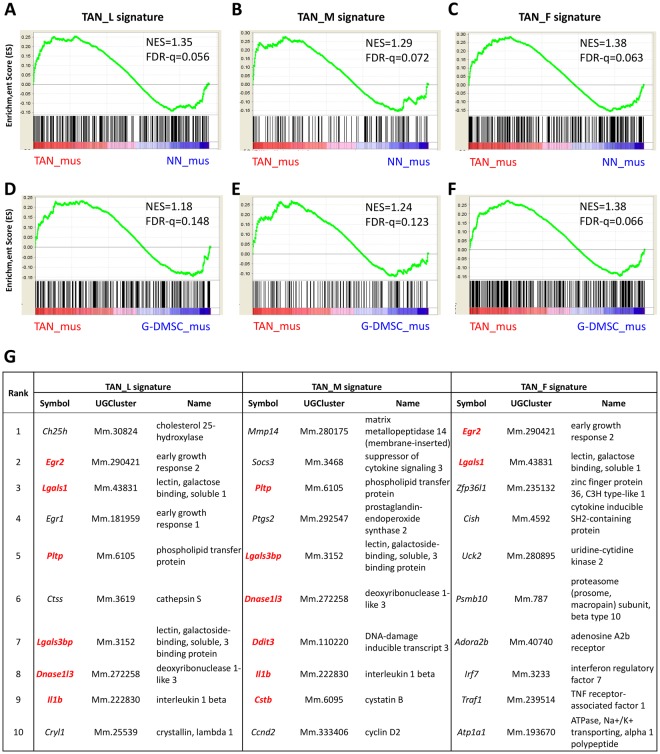
Figure 5.
Enrichment of TAN signatures in comparison to mouse TAN dataset. (A–F) Enrichment plots by GSEA in comparison of zebrafish TANs with mouse TAN (A–C) or G-MDSC (D–F). Up-regulated genes from TAN_L (A,D), TAN_M (B,E), and TAN_F (C,F) as signatures were compared to a mouse TAN microarray dataset (GSE43254) by GSEA. The similarity between zebrafish TAN groups and mouse TAN (TAN_mus) was separately compared against mouse NN (NN_mus, A–C) and against mouse G-MDSC (G-MDSC_mus, D–F). NES indicate the correlation between two dataset and a positive value refers to positive correlation. FDR measures the statistical significance of NES, and the value below 0.25 is regarded as significance. (G) List of the top 10 leading edge genes between zebrafish TAN groups and TAN_mus basedon mouse gene symbols. The leading edge genes which also emerged in other TAN groups are labeled in red.

