Fig. 2.
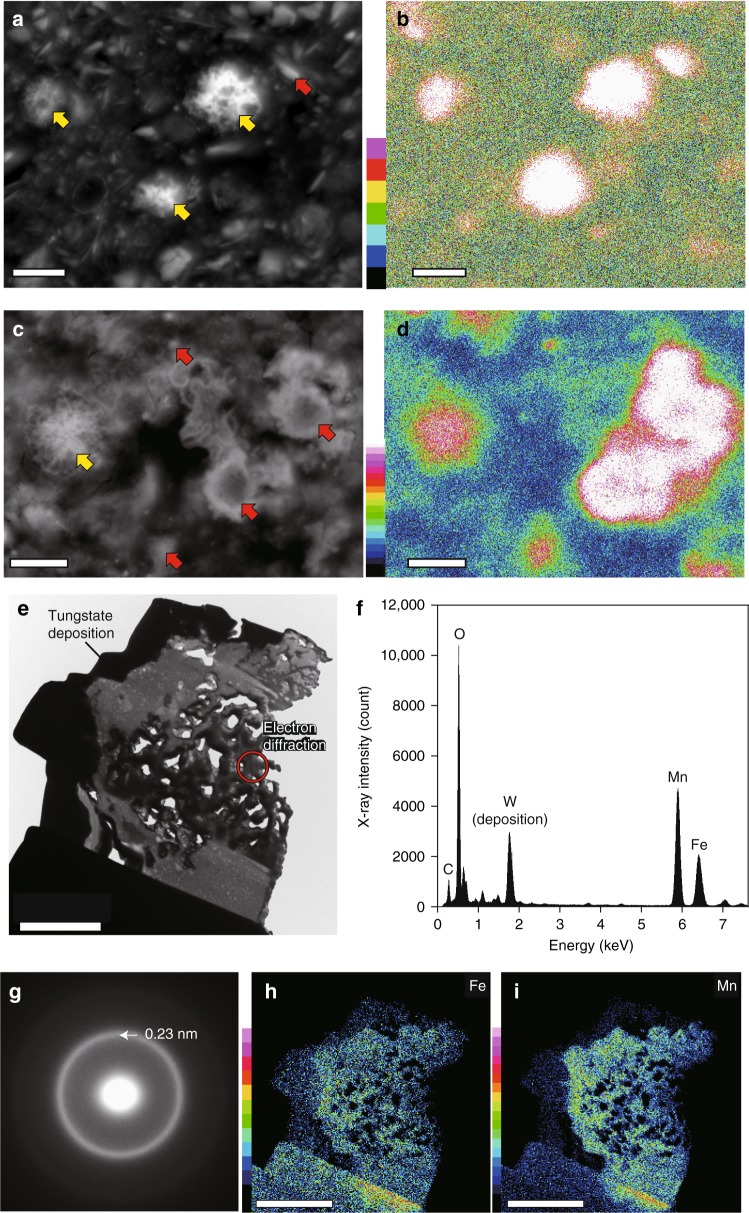
Composition and mineral characteristics of Mn-microparticles. a–d Representative elemental map of manganese in a resin-embedded sediment sample. Scale bars, 5 μm: a A back-scattered electron (BSE) image acquired by scanning electron microscopy (SEM) and b an energy-dispersive X-ray spectroscopy (EDS) elemental map of manganese for sample U1365D-1H-2 0/20; c A back-scattered electron (BSE) image acquired by SEM and d an elemental map of manganese for sample U1365D-9H-3 35/55; yellow arrows indicate Mn-microparticles, and red arrows indicate manganese-concentrated particles without concentric growth structure and fibrous structure in the samples herein. e–i Representative transmission electron microscopy (TEM) analysis results for Mn-microparticles. Scale bars, 2 μm: e cross-sectional TEM image of an FIB-cut Mn-microparticle, and f an EDS spectrum; the W peak is an artifact derived from contaminated W-deposition during focused ion-beam (FIB) fabrication. g Electron diffraction pattern. h, i Elemental maps for Fe and Mn, respectively, in sample U1365C-1H-2 0/20. Based on the EDS spectrum and electron diffraction pattern, the main constituent is poorly crystalline ferromanganese oxide

