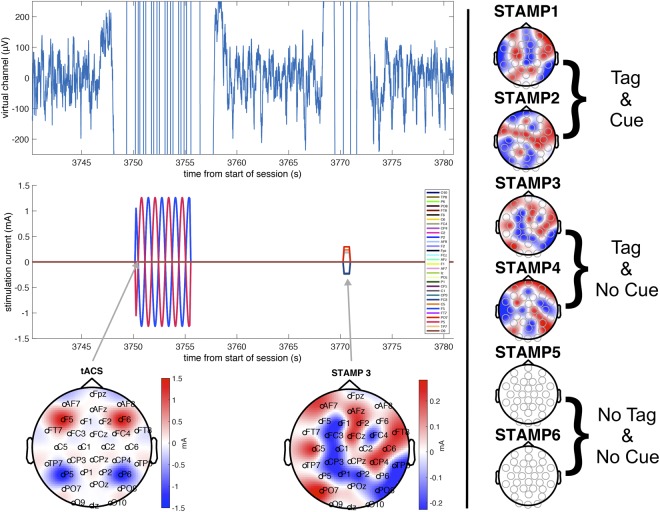
Figure 5.
Illustration of the stimulations used in the experiment. Left panel (top) shows time-locked plots of the EEG virtual channel recording used in the SW detection algorithm, filtered from 0.5 to 50 Hz, before, during and after representative tACS and STAMP stimulations; Left panel (middle and bottom) shows stimulation amplitude and matching scalp topography for a representative subject. Here, stimulation is triggered by increases in SW power and is coupled to oscillations in the SW band (0.5 to 1.2 Hz). Clear stimulation artifacts can be seen surrounding the application of both tACS and STAMPs, as well as the return to normal range of amplitudes following the offset. Right panel shows the set of STAMPs assigned to this representative subject, with STAMPs 1 and 2 assigned to the ‘Tag’ condition, i.e., stimulated only during training; STAMPs 3 and 4 assigned to the ‘Tag & Cue’ condition, i.e., stimulated during both training and sleep; and STAMPs 5 and 6 assigned to the Control condition where no currents are applied. Note that the assignment of STAMPS to sequences was randomized for each subject and counterbalanced across subjects.

