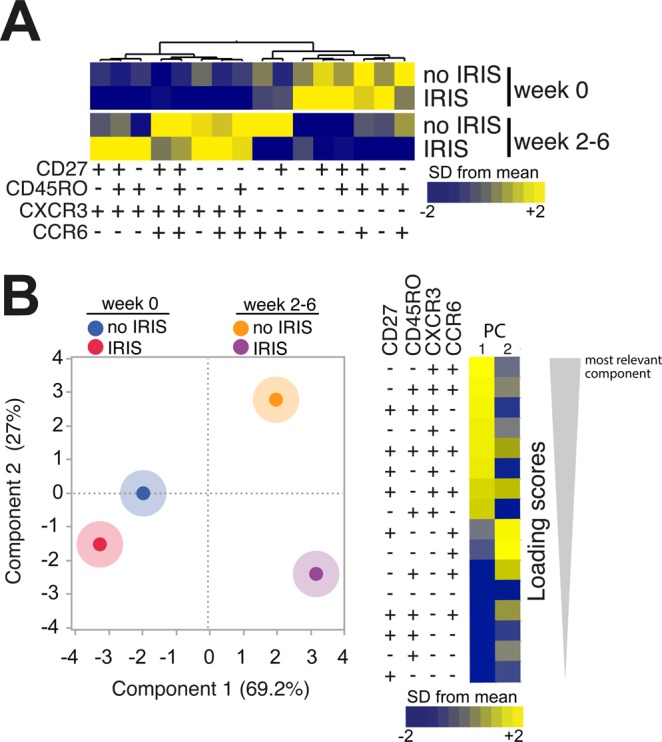
Figure 3.

TB-IRIS patients can be distinguished from non-IRIS based on simultaneous assessment of memory markers and chemokine receptors. (A) Hierarchical cluster analysis of the z-score normalized average frequency values of the indicated CD4+ T cell phenotypes is shown to summarize the overall trends of data variation between the study groups and timepoints. Yellow color represents the highest values whereas blue color indicates the lowest values observed for each cell type. (B) A PCA model was employed to test whether a combination of the memory cell markers and chemokine receptors could cluster patients with IRIS vs. non-IRIS at week 0 (pre-ART) and at week 6 post-ART initiation (right panel). Loading Scores reflect the strength that the combination of markers represents in each principal component shown (left panel).
