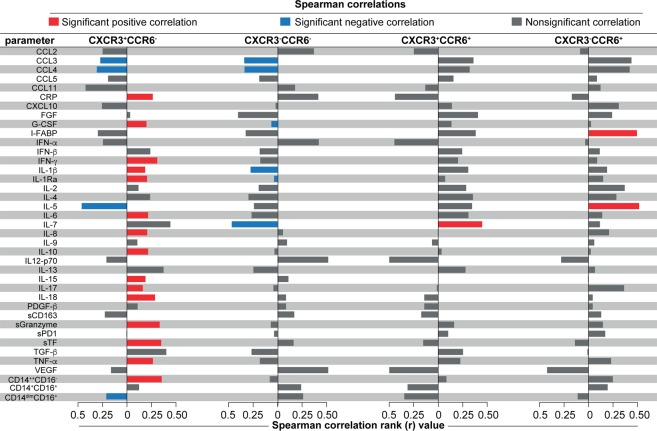
Figure 5.
Associations between changes in systemic inflammation between before and after ART commencement and frequencies of CD4+ T cell subtypes. For the entire study population, change in inflammation over time was estimated by calculating fold-differences of concentrations of each indicated plasma markers as well as for frequencies of the monocyte subsets, from pre-ART to week 2–6 after ART initiation (values at week 2–6 divided by values from pre-ART). Spearman analysis was used to test correlations between changes values of the inflammatory markers and frequencies of the indicated CD4+ T cell subsets in peripheral blood at the time of TB-IRIS event or equivalent timepoint. Colored bars indicate statistically significant correlations (p < 0.05) after adjustment for multiple measurements.

