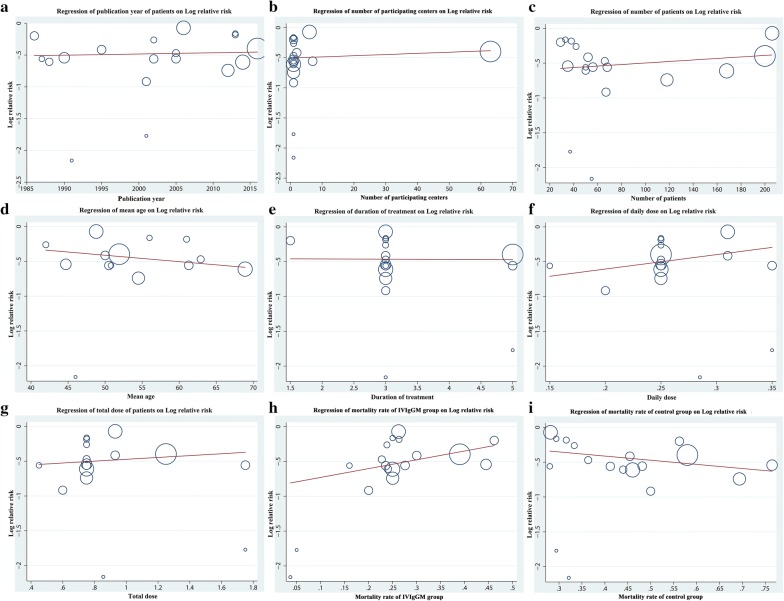
Fig. 4.
Random-effects meta-regression analyses showing the relationship between the study effect size and a publication year, b number of participating centers, and mortality rates of the IVIgGM and control groups. c Number of patients, d mean age, e duration of treatment, f daily dose, h total dose, i mortality rates of the IVIgGM, j mortality rates of the control groups. The size of the circles is inversely proportional to the size of the result study variance, so that more precise studies have larger circles

