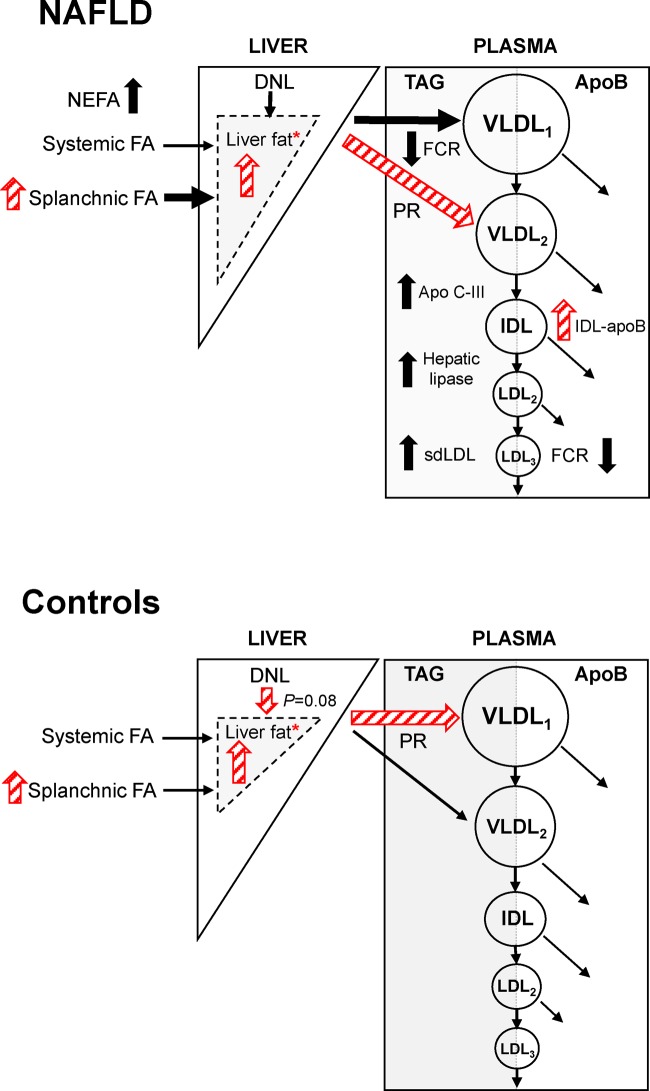
Figure 2. Summary schematic of the relative effects of the high and low sugar diets on the lipoprotein metabolism of men with NAFLD and low liver fat controls.
The relative effects of the high and low sugar diets on lipoprotein metabolism are shown as red hatched arrows. The thickness of black arrows represents the magnitude of pathway in men with NAFLD relative to controls (PR, production rate; FCR, fractional catabolic rate). *Significance of increases in liver fat in both NAFLD and controls, after the high sugar diet relative to the low sugar diet, were not maintained after adjustment for body weight.

