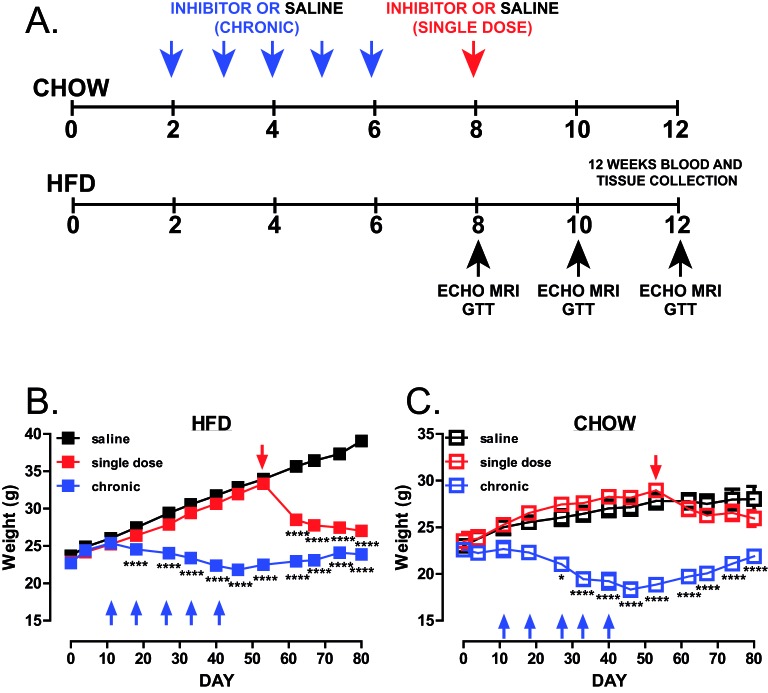
Figure 1. Global PTP1B inhibition leads to reduced body weight.
(A) Schematic representation of the experimental design. LDLR−/− male mice were divided into HFD-fed and chow-fed saline-treated, single-dose trodusquemine (10 mg/kg I.P. at week 8) and chronic trodusquemine (a single 10 mg/kg I.P. followed by four weekly injections at 5 mg/kg). (B,C) Weights of mice during the course of the experiment-fed HFD (B, n=24 per group) or chow (C, n=4 per group). Data are represented as mean ± S.E.M. and analysed by two-way ANOVA followed by Bonferonni multiple comparison t tests where *P≤0.05, or ****P≤0.0001 when compared with saline-treated control mice.

