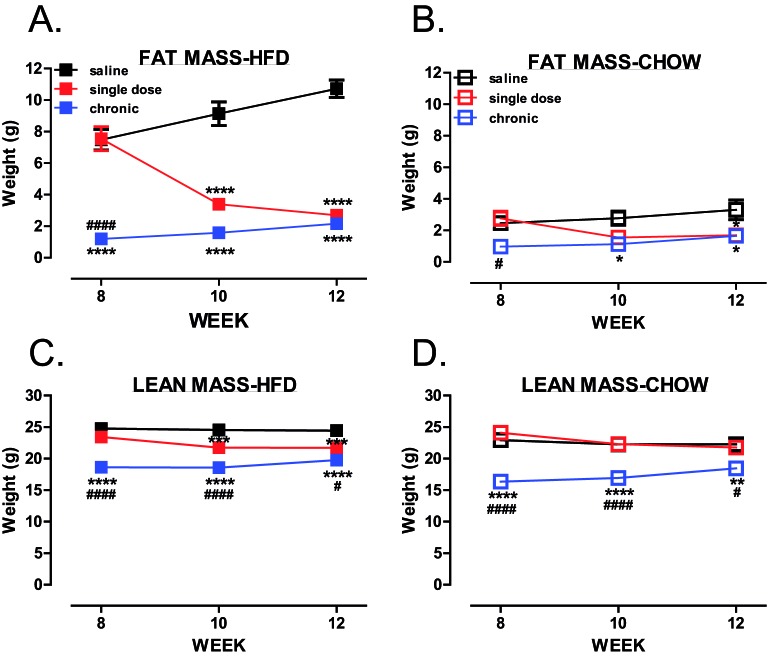
Figure 2. Global PTP1B inhibition leads to reduced adiposity.
(A–D) Body composition was analysed using an Echo MRI 3-in-1 scanner where total body fat (A,B) and lean mass (C,D) were determined (HFD, n=9–11 per group; chow, n=4 per group). Data are represented as mean ± S.E.M. and analysed by two-way ANOVA followed by Bonferonni multiple comparison ttests where *P≤0.05, **P≤0.01, ***P≤0.001, ****P≤0.0001 when compared with saline treated control mice or #P≤0.05, ####P≤0.0001 when single dose and chronic groups were compared with each other.

