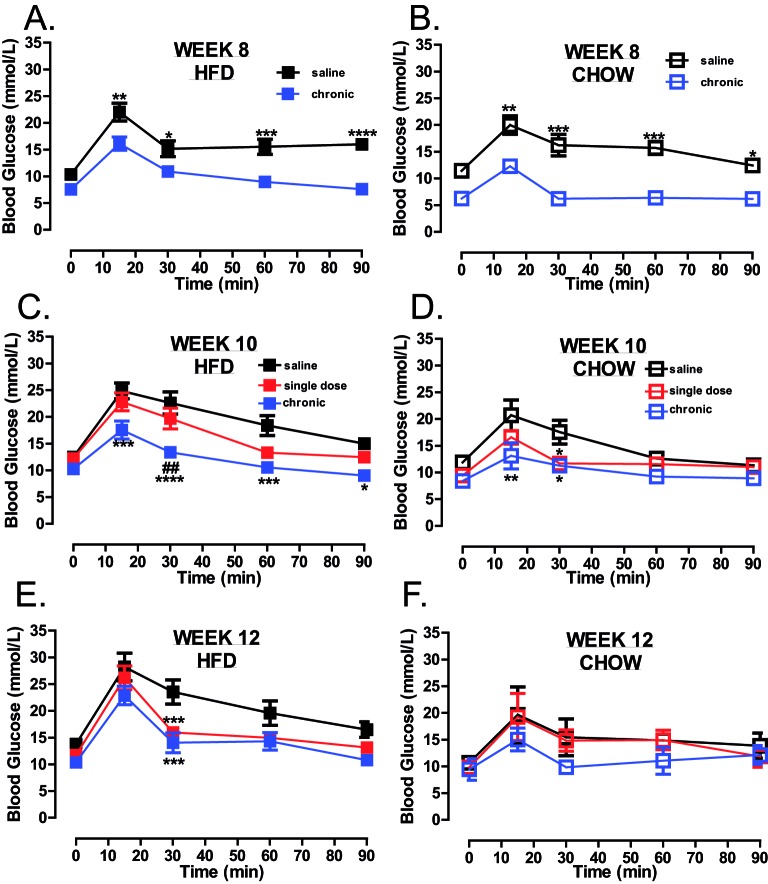
Figure 3. Global PTP1B inhibition improves glucose maintenance.
GTTs of saline, single dose and chronic drug treated mice fed on HFD (A,C,E) or chow (B,D,F) diets at week 8, 10 and 12. Mice were fasted for 5 h prior to basal glucose monitoring (as described in Methods section) and subsequently mice were injected I.P. with 20% glucose (w/v), and blood re-analysed at 15, 30, 60 and 90 min post-injection (HFD, n=8 per group; chow, n=4 per group). Data are represented as mean ± S.E.M. and analysed by two-way ANOVA followed by Bonferonni multiple comparison ttests where *P≤0.05, **P≤0.01, ***P≤0.001, ****P≤0.0001 when compared with saline treated control mice or ##P≤0.01 when single dose and chronic groups were compared with each other.

