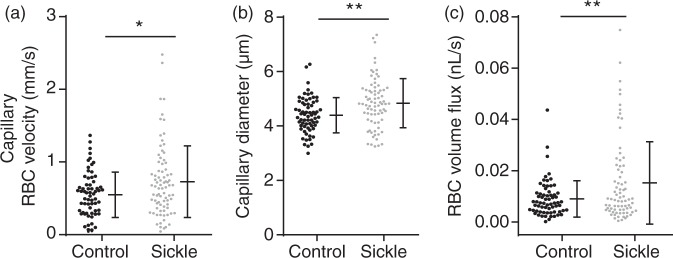
Figure 1.
Altered capillary vasodynamics in the sickle cell compared to control mice. Red blood cell velocity (a), mean capillary diameter (b), and red blood cell flux (c) were significantly higher among sickle cell mice compared with controls (p = 0.013, 0.014, 0.021 for RBC velocity, capillary diameter, and flux, respectively; Mann–Whitney U-test). Error bars represent mean ± SD, 1−β = 0.92 in (a), 0.95 in (b), and 0.99 in (c).

