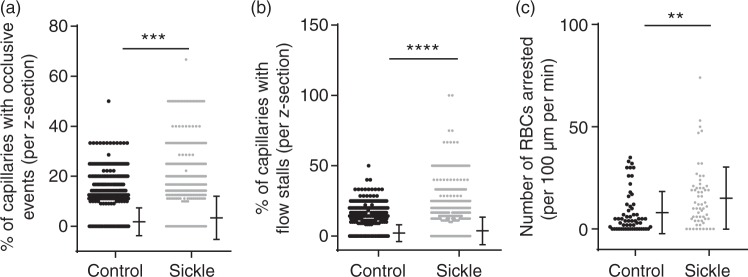
Figure 3.
Higher prevalence and severity of evidence of cerebral vasculopathy in the sickle cell mice compared to controls. (a) Higher number of occlusive events (p < 0.001) (b) blood flow stalls (p < 0.0001) and (c) arrested RBCs (p = 0.036) were observed in sickle cell, compared to control mice. Comparison done using Mann–Whitney U-test and error bars represent mean ± SD, 1−β = 0.99 in (a), 0.99 in (b), and 0.95 in (c). Note that in Figure 3(a), 2940 out of 3296 and 3298 out of 3900 data points for controls and sickle mice respectively have a value of zero percent. And in Figure 3(b), 2872 out of 3300 and 3287 out of 3900 data points also have a value of zero percent.

