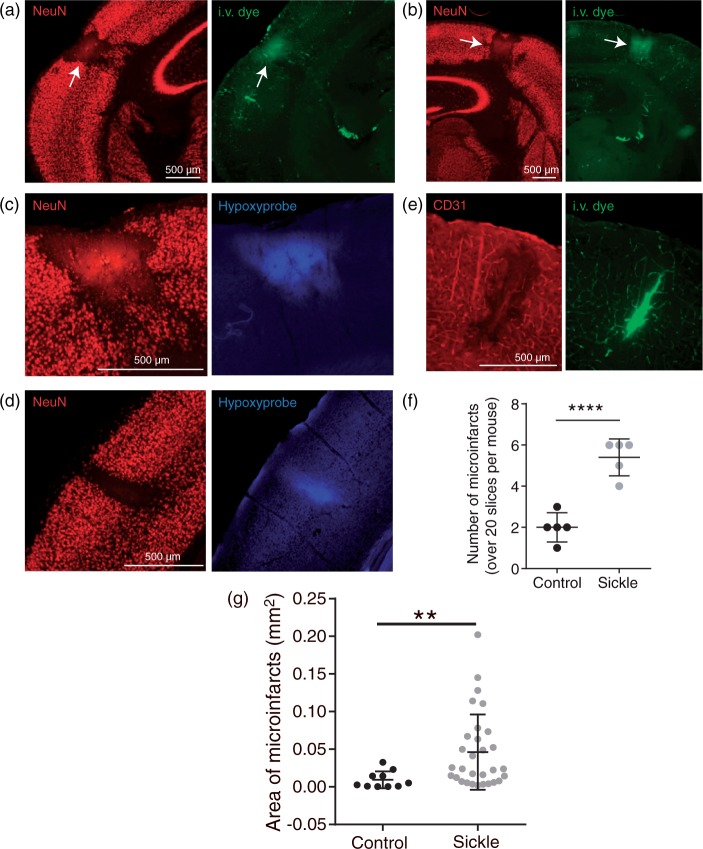
Figure 4.
Higher frequency of spontaneous cerebral microinfarcts in the sickle cell compared to control mice. Representative images of cortical microinfarcts in sickle cell (a, b and c) and control (d) mice. Regions devoid of NeuN staining, a marker of neuronal viability, mark the boundaries of the microinfarcts. Extravasation of the intravenous dye, FITC-dextran, in and around the microinfarct core is consistent with blood–brain barrier disruption. (c, d) Hypoxyprobe labeling marks regions of tissue hypoxia. (e) CD31 staining for endothelial cells, showing endothelial damage in the microinfarct core where there was also leakage of FITC. (f) Sickle cell mice had a 2.5-fold higher frequency of microinfarcts compared to control mice (p < 0.0001). (g) Finally, sickle cell mice had significantly larger average area of infarct compared to controls (p = 0.0021). Comparison between groups was performed using Mann–Whitney U-test and error bars represent mean ± SD, 1−β = 0.99 in (f) and 0.94 in (g).

