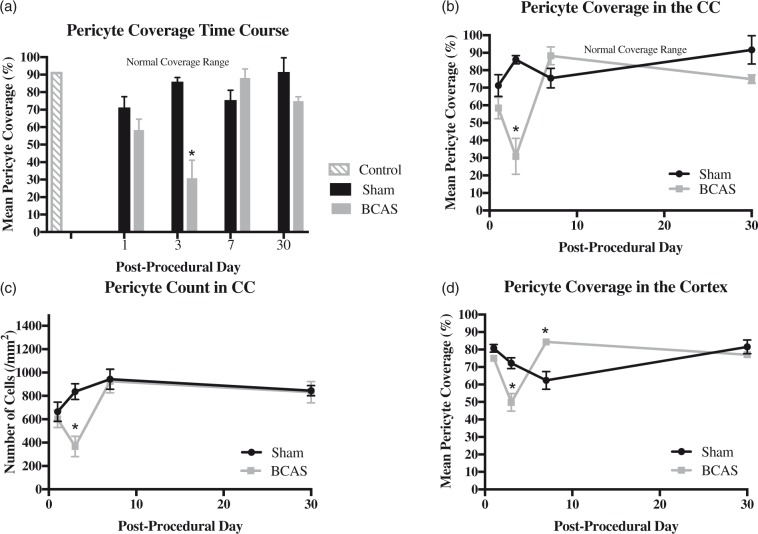
Figure 6.
(a–c): Pericyte coverage and count in the corpus callosum. (a) Coverage bar graph. (b) Coverage time plot. (c) Count time plot. Values are depicted for BCAS and sham animals on days 1, 3, 7, 30. Two sections were used per mouse. Sections were taken from the right and left medial corpus callosum. (a–b) Controls (n = 2). BCAS pericyte coverage cohort (day 1, n = 3; day 3, n = 3; day 7, n = 3; day 30, n = 3). Sham pericyte coverage cohort (day 1, n = 3, day 3, n = 4; day 7, n = 4; day 30, n = 4). Day 3 BCAS values are significantly lower than values on day 7 and 30. Day 3 BCAS values are also significantly lower than mean values of the sham cohort at day 3. Shaded grey region depicts normal, physiologic cortical pericyte coverage values. * Signifies p < 0.05. Error bars represent standard error of the mean. (c) BCAS pericyte count cohort (day 1, n = 3; day 3, n = 3; day 7, n = 3; day 30, n = 3). Sham pericyte count cohort (day 1, n = 3; day 3, n = 4; day 7, n = 4; day 30, n = 4). Day 3 BCAS values are significantly lower than values on day 7 and 30. Day 3 BCAS values are also significantly lower than mean values of the sham cohort at day 3. (d) Pericyte coverage time plot in the cortex. Values are depicted for BCAS and sham animals on days 1, 3, 7 and 30. BCAS cohort (day 1, n = 3; day 3, n = 3; day 7, n = 3; day 30, n = 3). Sham cohort (day 1, n = 3; day 3, n = 4; day 7, n = 4; day 30, n = 4). Two sections were used per mouse. Sections were taken from the right and left cortex above the corpus callosum. Day 3 BCAS values are significantly lower than mean values of the sham cohort at day 3. Day 7 BCAS values are significantly increased compared to mean values of the sham cohort at day 7. *Signifies p < 0.05. Error bars represent standard error of the mean.

