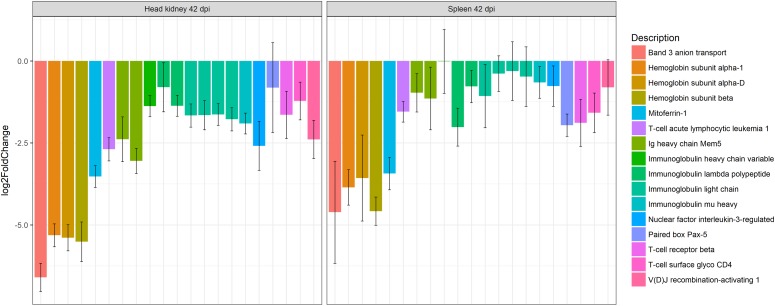
FIGURE 3.
Barplot showing the log2 fold change differences between control and E. scophthalmi-infected turbot in head kidney and spleen at 42 days post-infection for genes involved in erythropoiesis and adaptive immune response. The expression profile reflects the lymphohematopoietic depletion observed in turbot with advanced enteromyxosis. Error bars indicate ± SE.

