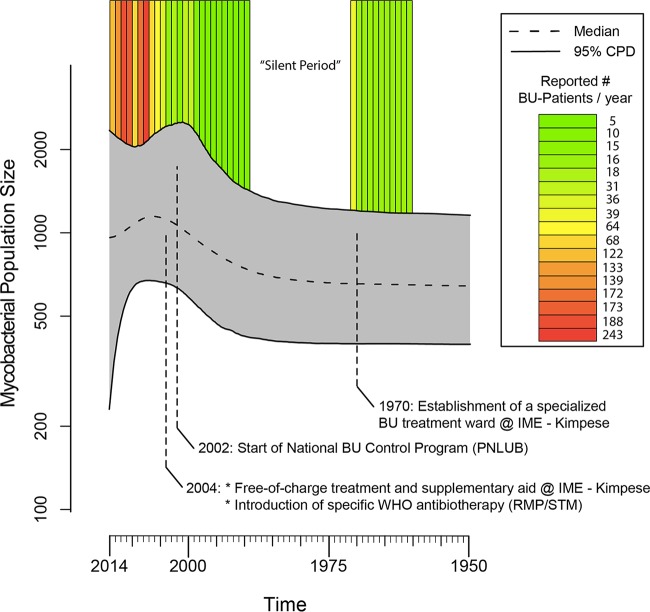
FIG 4.
The demographic history of M. ulcerans in the Songololo territory and the annual amount of cases from the Territory reported by the national BU program (Program National de Lutte contre L’Ulcère de Buruli [PNLUB]). The extended Bayesian skyline plot displays a relative measure of the mycobacterial population size (Ne* τ) through time (with Ne representing the effective population size and τ symbolizing the mean mycobacterial generation time). As this is an arbitrary scale, it only allows us to discuss relative increases or decreases to the population size. The central dotted line represents the median mycobacterial population size with its 95% central posterior density (CPD) interval represented by the upper and lower lines. Note the y axis is on the log scale. New BU cases were regularly identified before 1970, after which there was a 20-year-long “silent” period in the scientific literature, during which no cases were reported. During this period, the hospital lost the majority of its specialized personnel, which was partially due to the political situation in the Democratic Republic of the Congo at that time. This led to Institut Médical Evangélique’s (IME’s) lowest recorded (all-cause) admission rate of 4.5 patients/year between 1989 and 1999 (58). Later, in 2002, the national BU program PNLUB was started, and during 2002 to 2004, an apparent resurgence of BU was reported in the Songololo territory (59). Since the end of 2004, the IME hospital in Kimpese launched a specialized BU program, offering free-of-charge treatment and supplementary aid. Additionally, starting in 2004, patients benefited from specific antibiotherapy which was introduced in accordance with WHO recommendations (60). Since the start of the BU control project, a strong increase was noted in the number of notified BU cases, including those admitted to IME hospital (61).

