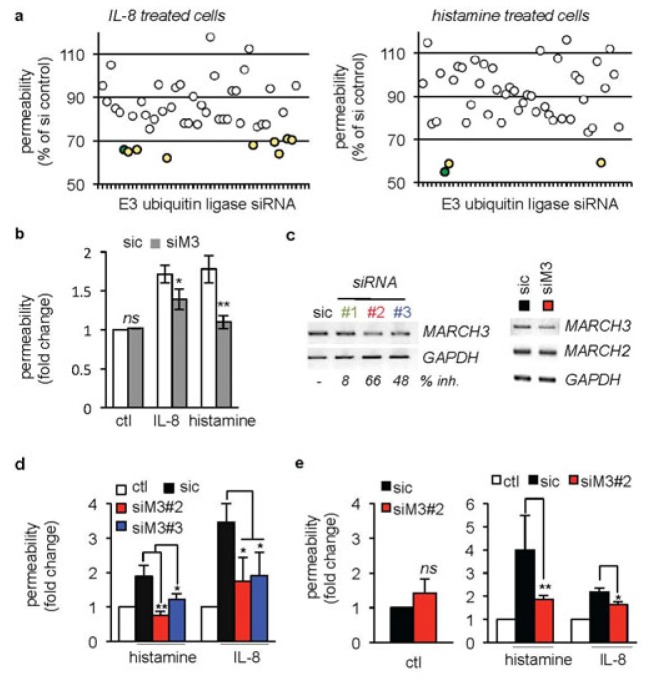
Figure 1. A siRNA library screen identifies the E3 ubiquitin ligase MARCH3 in the endothelial barrier function.
(A) HUVECs were transfected with two siRNA sequences targeting 46 transmembrane-anchored E3 ubiquitin ligases (Table S1, [21]) or non-silencing control duplexes RNA (sic) and plated onto collagen-coated inserts. Three days later, monolayers were starved overnight prior 30 min stimulation with either IL-8 (50 ng/ml) or histamine (100 mM). Sic-transfected untreated and treated cells were used as internal controls. FITC-dextran permeability was expressed as percentage of inhibition with respect to sic-transfected treated cells (% of siRNA control). Hits were considered, when permeability was reduced by a third (yellow dots). MARCH3 is shown in green. (B) HUVECs were transfected with either non-silencing duplexes (sic) or MARCH3-targeting siRNA (siM3, from the library panel A). Permeability was assessed upon IL-8 and histamine challenge three days later. (C) HUVECs were transfected with three different siRNA sequences targeting MARCH3 (siM3). Knockdown efficiency was assessed by RT-PCR and quantitative densitometry represented as percentage of inhibition (% inh.).. Scans are representative of two independent experiments. (D–E) FITC-dextran permeability was measured in similarly treated sic- and siM3-transfected HUVECs (D) and brain endothelial cells hCMEC/D3 (E). Values were expressed as a fold to untreated sic-transfected cells (ctl). Red/blue columns were compared to the black ones. In addition, p<0.001 and p<0.01 for black columns compared to the white ones in (D) and (E), respectively. All panels are representative of at least three independent experiments, except when specified. ANOVA test and T-test *, p<0.05; **, p<0.01.

