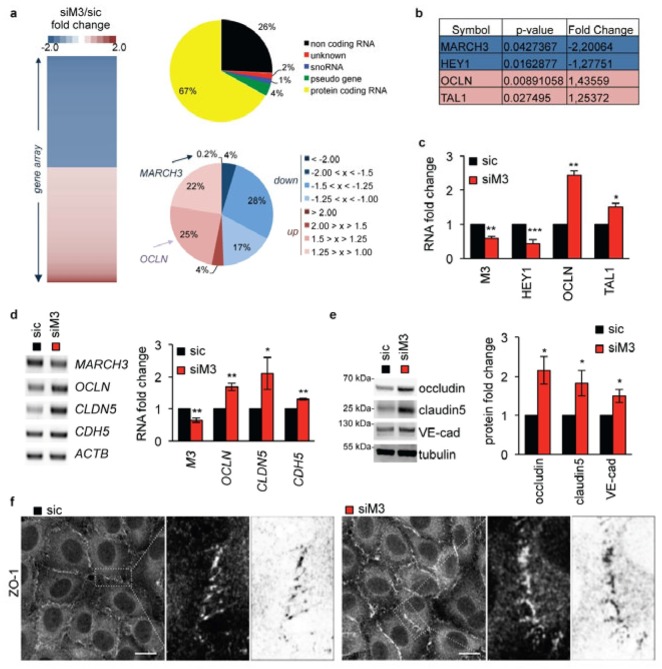
Figure 3. Tight junctions are strengthened in MARCH3-depleted cells.
(A) Gene array analysis of siM3-transfected human brain endothelial cells compared to sic-transfected cells (Table S2). Heat-map of up- (>1.25, red) and down-regulated (<1.25, blue) genes, from siM3/sic fold changes in three independent experiments. The repartition of significantly (p<0.05) up- and down-regulated sequences is shown (top diagram). Protein coding RNAs (in yellow, 67% of total gene) were then classified according to their fold change of expression (siM3/sic, bottom diagram). (B–C) Table includes two of the best down- (blue) and up-regulated (red) genes (symbol names), together with p-value and fold change. Samples used for gene array were further processed for RT-PCR to validate main hits. (D–E) mRNA (D) and protein (E) expression of indicated targets were monitored three days post-transfection by RT-PCR and western-blots, respectively. Graphs showed quantification of fold change in three independents experiments. (F) Confocal analysis of tight junction-associated protein ZO-1 in sic- or siM3-transfected endothelial cells. Zoom on cell borders is shown on the right panel, together with an inverted image as processed by Image J (Fiji). Scale bars: 10 μm. All panels are representative of at least three independent experiments. T-test *, p<0.05; **, p<0.01; ***, p<0.001.

