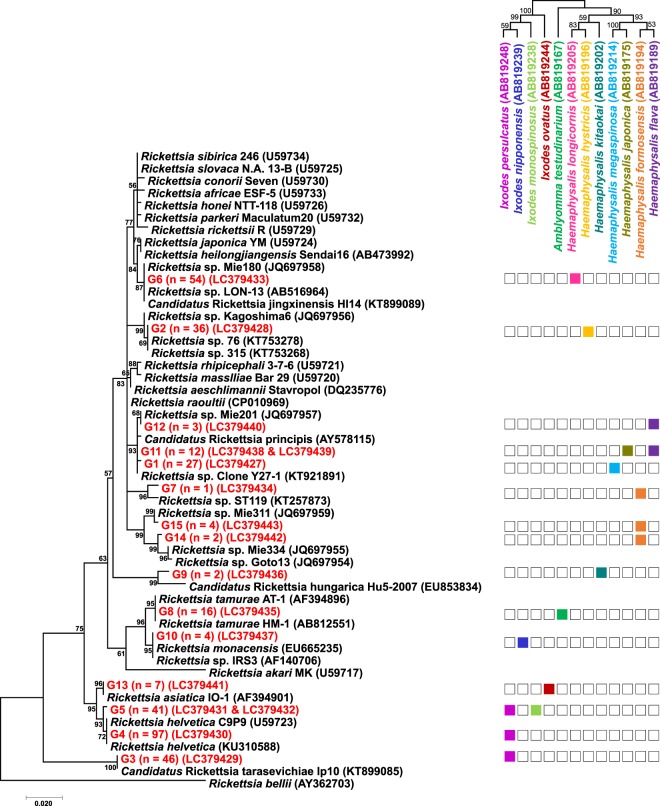
Figure 1.
A phylogenetic tree of spotted fever group rickettsiae based on the gltA gene sequences (537 bp). The analysis was performed using a maximum likelihood method with the Kimura 2-parameter model. All bootstrap values from 1,000 replications are shown on the interior branch nodes. The sequences detected in this study are indicated in red. The number of samples positive for each genotype is indicated in the parentheses. The simplified tick phylogeny consisting of 12 tick species is indicated on the top right. The colour highlights in the column indicate the presence of infections in each tick species.

