
Figure 4.
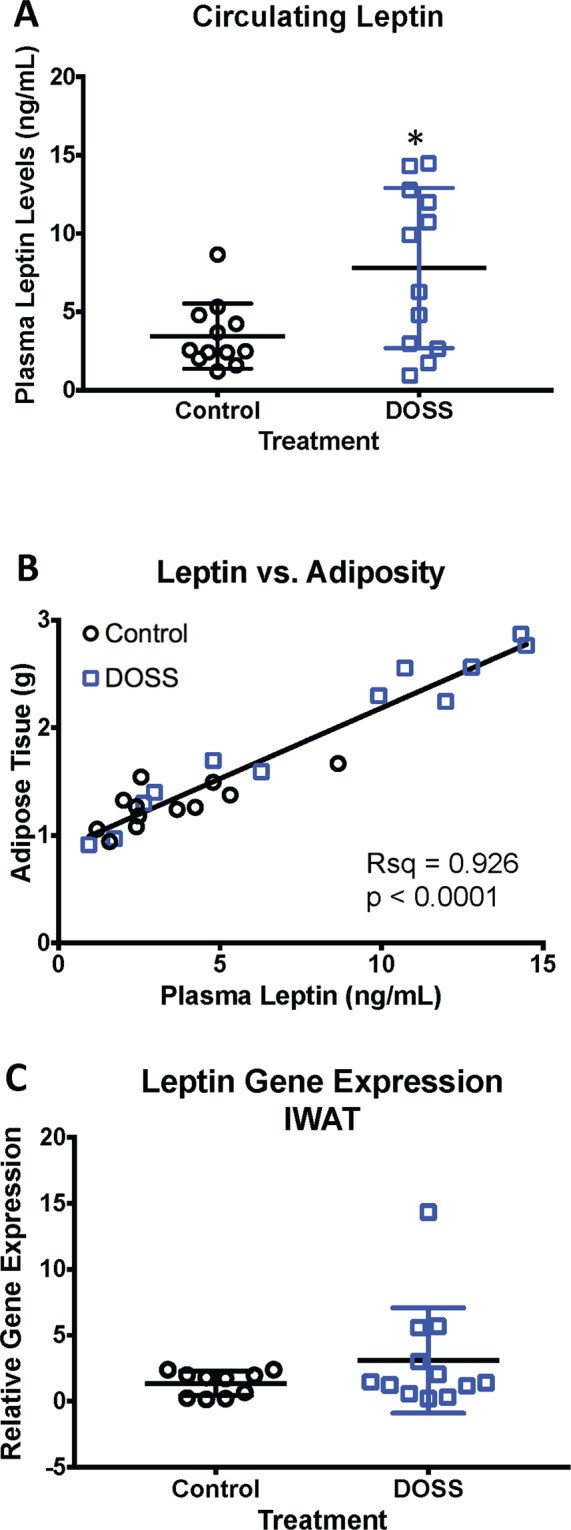
Developmental DOSS treatment alters circulating levels of leptin in male F1 mice. At time of sacrifice (16 weeks), plasma and adipose tissue was collected (n = 12/group). Circulating levels of leptin were determined using MSD assays. Gene expression was determined via RNA isolation, cDNA conversion and qPCR using the delta delta Ct method with Hprt as the housekeeping gene. Results are shown for (A) normalized circulating levels of leptin, (B) leptin correlated with fat mass, and (C) leptin gene expression in IWAT (n = 12/group). Graph bars represent means and standard deviations. Linear regression was used to determine correlations between adiponectin and leptin and fat mass (*p < 0.05 unpaired t-test).