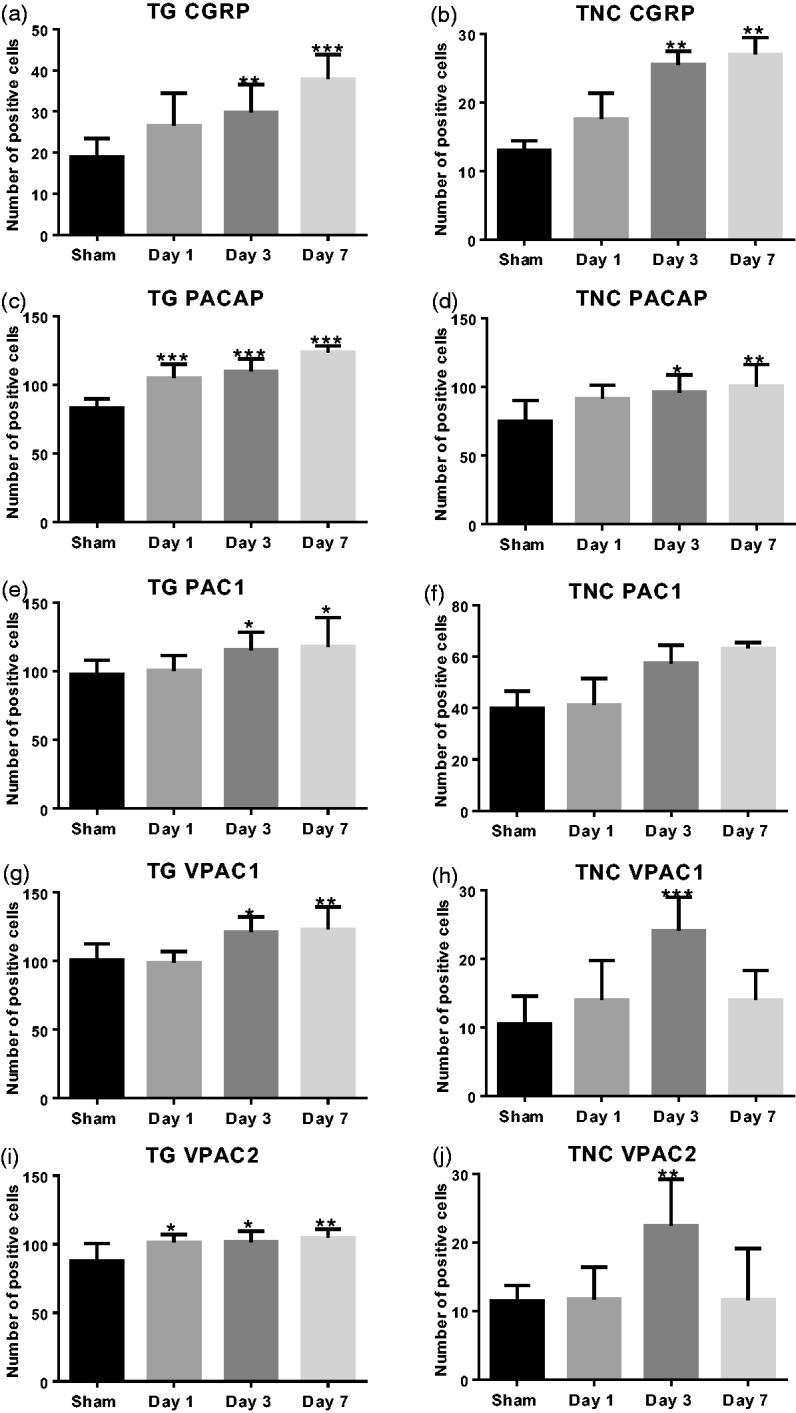
Figure 6.

Dynamic expressions of CGRP, PACAP, PAC1, VPAC1, and VPAC2 receptors in the TG and the TNC during repetitive ES. Y-axis shows the average number of positive cells (six images per animal, six animals per group) at 20× magnification of the TG and at 50× magnification of the TNC as specified in “Materials and Methods” section. Data are represented by mean ± standard deviation. (a and b) The numbers of CGRP+ cells were increased in both TG and TNC during repetitive ES. (c and d) PACAP showed a similar pattern as CGRP: increased in both TG and TNC. (e and f) PAC1 receptor was increased from Day 3 to Day 7 in both TG and TNC. (g and h) VPAC1 receptor was increased from Day 3 to Day 7 in the TG, while in the TNC, it also peaked on Day 3 and then decreased by Day 7. (i and j) VPAC2 receptor reached a steady level from Day 1 to Day 7 in the TG, while in the TNC, it also peaked on Day 3 and then decreased by Day 7. Compared with the Sham group: *P < 0.05; **P < 0.01; ***P < 0.001.
TG: trigeminal ganglion; TNC: trigeminal nucleus caudalis; CGRP: calcitonin gene-related peptide; PACAP: pituitary adenylate cyclase-activating peptide; PAC1: ■; VPAC1: ■; VPAC2: ■.
