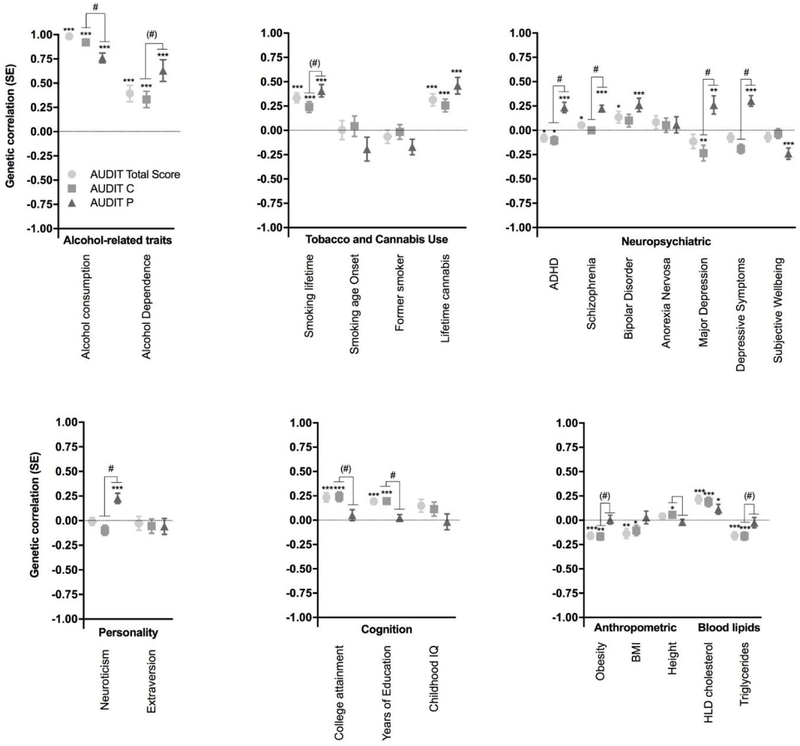
Figure 2.
Genetic correlations between the three AUDIT phenotypes (total score, AUDIT-C, AUDIT-P) and several traits measured in independent cohorts as described in the Supplementary Tables 3–5: alcohol-related traits, tobacco and cannabis use, neuropsychiatric, personality, cognition, anthropomorphic and blood lipids. ADHD, attention-deficit/hyper-activity disorder; BMI, body mass index; SE, standard error; IQ, intelligence quotient; HDL, high-density lipoprotein. * p < 0.05, ** p < 0.01, *** p < 0.0001; # AUDIT-P vs AUDIT-C, p < 0.01 FDR 5%, (#) AUDIT-P vs AUDIT-C, p < 0.05

