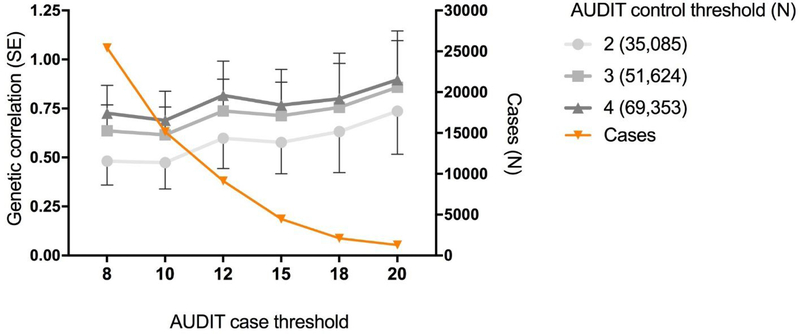
Figure 3.
Genetic correlations between AUDIT cases (8 [N = 25,423], 10 [N = 15,151], 12 [N = 9,130], 15 [N = 4,471], 18 [N = 2,099], 20 [N = 1,290]) vs controls (2, 3, 4) in the UK Biobank and DSM-IV derived alcohol dependence from the Psychiatric Genetics Consortium. The orange line is a visualization of the number of cases used at each threshold, corresponding to the N on the right hand y-axis.

