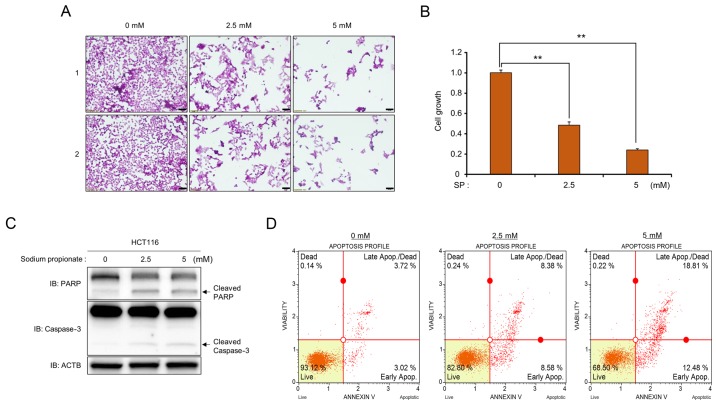
Figure 1.
SP induces cell apoptosis in the HCT116 cell line. (A and B) Cell growth assay (crystal violet staining and CCK-8 analysis). (A) After treatment with SP (0, 2.5 and 5 mM), cell fixation with 100% methanol and cell staining with crystal violet were performed. ‘1’ and ‘2’ are results of two independent experiments after treatment with SP. The cells were imaged under a microscope. Scale bar, 50 µm. (B) In addition, CCK-8 solution was added to the culture medium, and an incubation step was performed for 10 min at 37°C. The intensity of cell growth was assessed by a microplate reader (450 nm). P-values were calculated using one-way ANOVA (**P<0.01). (C) Western blot analysis after treatment with SP using anti-PARP and anti-caspase-3 antibodies. ACTB was used as the internal control. (D) FACS analysis using Annexin V staining was performed after treatment with SP. The lower right and upper right quadrants indicate early apoptosis and late apoptosis, respectively. SP, sodium propionate, ACTB, β-actin.

