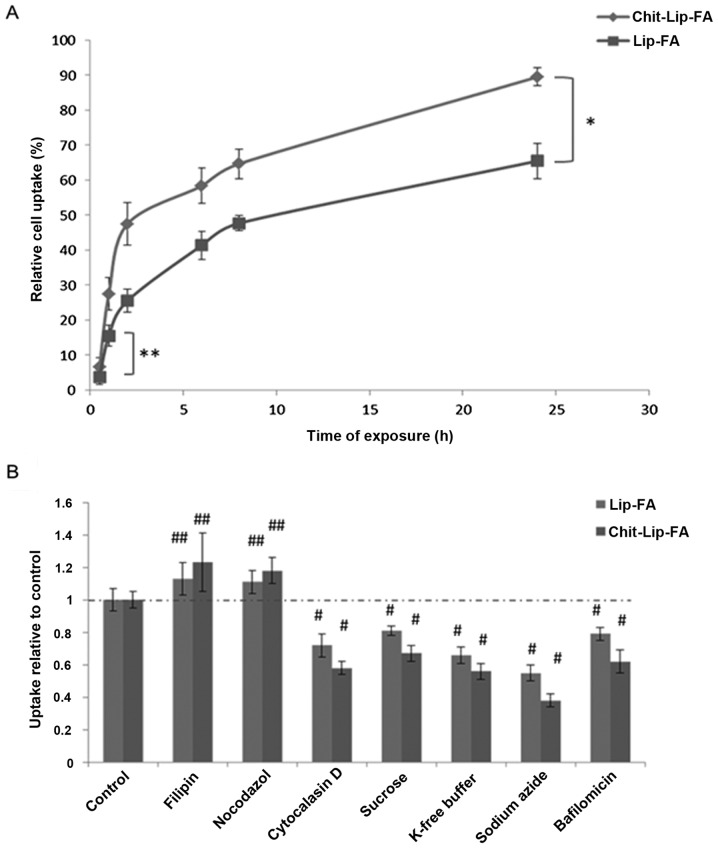
Figure 4.
(A) Overall cellular uptake of uncoated (Lip-FA) and coated fluorescent liposomes (Chit-Lip-FA) at 1 mg/ml in HepG2 cells (5×10³ cells/well) from 0.5 to 24 h. *P<0.001, **P<0.05. (B) Effects of different inhibitors on the internalization of uncoated and coated fluorescent liposomes (1 mg/ml) in HepG2 cells after 4 h of incubation. The data are normalized vs. their controls. #P<0.01 (difference between control and treatment group); ##P<0.05 (difference between control and treatment groups).

