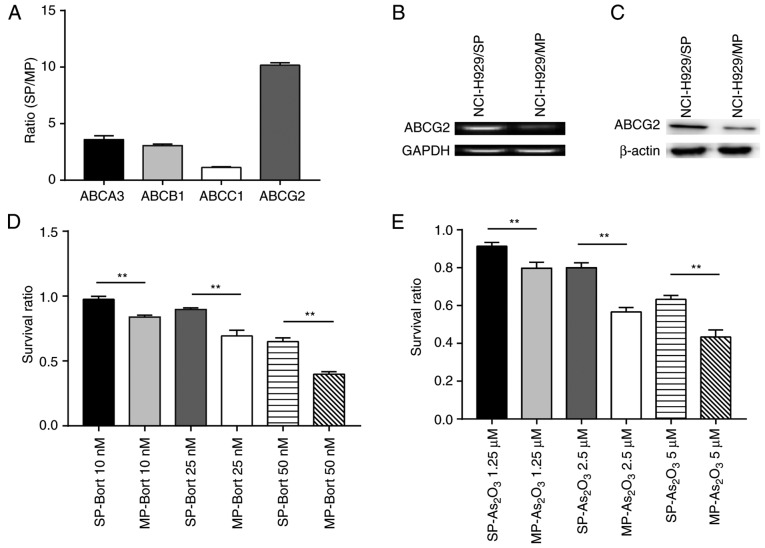
Figure 2.
SP cells express high levels of ABCG2 and display more potent chemoresistance than MP cells. (A) Ratios of ABCA3, ABCB1, ABCC1 and ABCG2 transcripts in SP NCI-H929 cells relative to MP NCI-H929 cells. (B) mRNA expression levels of ABCG2, as determined using DNA agarose gel electrophoresis. (C) ABCG2 protein expression levels were increased in SP cells compared with in MP cells. (D and E) Survival ratio of SP and MP cells treated with various doses of (D) Bort or (E) As2O3. **P<0.01. ABC, ATP binding cassette; ABCA3, ABC subfamily A member 3; ABCB1, ABC subfamily B member 1; ABCC1, ABC subfamily C member 1; ABCG2, ABC subfamily G member 2; As2O3, arsenic trioxide; Bort, bortezomib; MP, main population; SP, side population.

