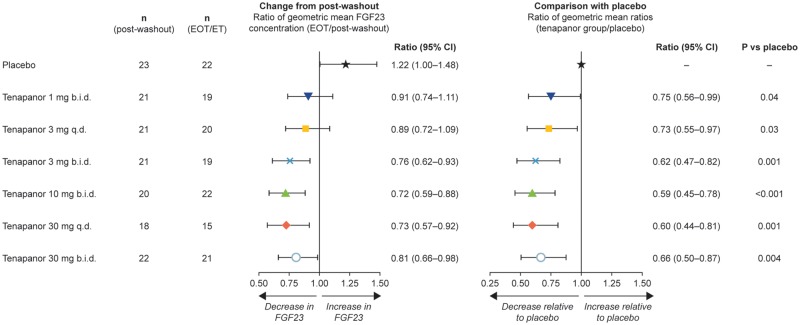
FIGURE 2.
Forest plots of ratios of geometric mean of serum FGF23 concentration following treatment with tenapanor or placebo. Data are presented as ratios (with 95% confidence intervals), which can be converted to percentage changes from post-washout or placebo treatment. ANCOVA was performed on data for the change from post-washout in natural log-transformed FGF23 concentration at the end of treatment/early termination, with treatment as a fixed factor and post-washout FGF23 (natural log-transformed) as a covariate. Ratios for change from post-washout reported previously [27]. b.i.d., twice daily; CI, confidence interval; EOT/ET, end of treatment/early termination; q.d., once daily.

