Fig. 5.

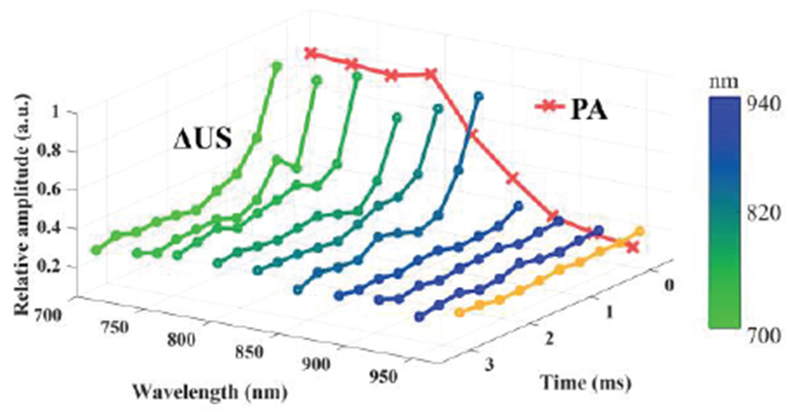
Mean intensity of PA and ΔUS images inside the tube as a function of optical wavelength and time after each laser pulse. Orange ΔUS line was obtained with US images under no laser irradiation.

Mean intensity of PA and ΔUS images inside the tube as a function of optical wavelength and time after each laser pulse. Orange ΔUS line was obtained with US images under no laser irradiation.