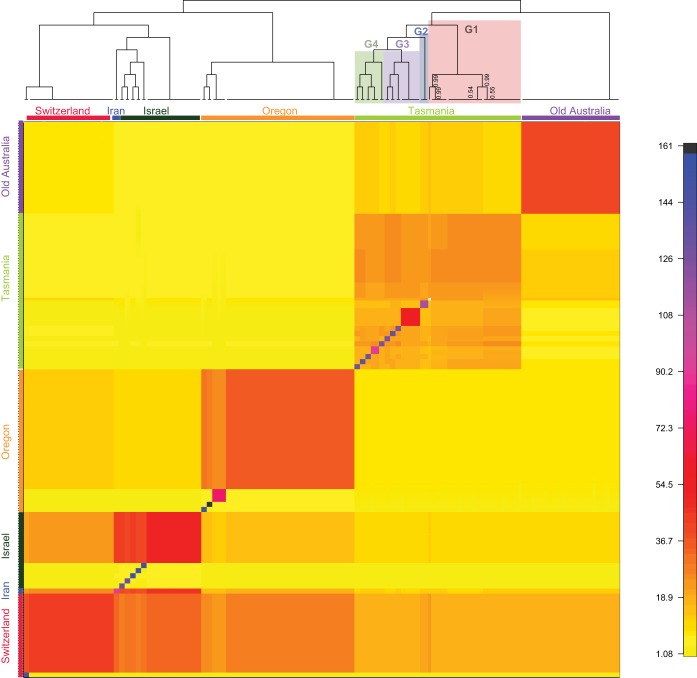
FIG 1.
Fine structure analysis of the resistant Tasmanian population in comparison to population in the rest of the world. This heat map shows the coancestry matrix of 218 Z. tritici individuals. The coloring of the heat map represents the number of shared genomic regions between different Z. tritici individuals. A strong population structure is visible where large blocks appear on the diagonal, whereby groups of related individuals share more of their genome with each other than with other individuals from other populations. The dendrogram shown at the top of the heat map shows which groups of isolates (populations) are more closely related to each other. Posterior support values are drawn only on branches where they were less than 1. For ease of viewing, the major clusters are colored according to the population of origin. The subgroups within the Tasmanian population (G1 to G4) are also colored.

