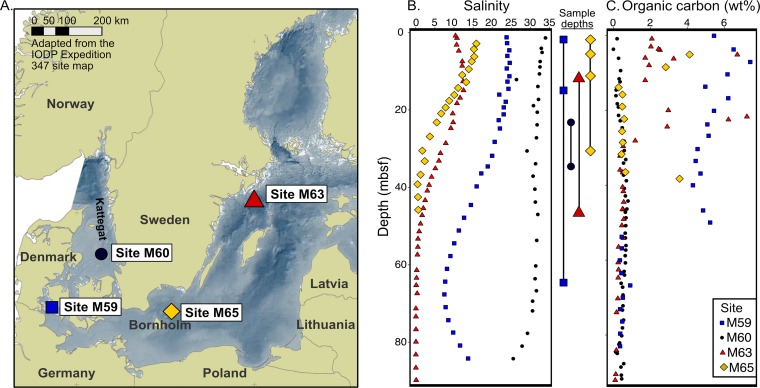
FIG 1.
(A) Map of the samples locations in the Kattegat and Baltic Sea Basin (map adapted from the IODP Expedition 247 site map [2] [coastline: ESRI data and maps, 2005; bathymetry: BALANCE project, www.helcom.fi]). (B and C) Chlorinity-based pore water salinity (B) and total organic carbon (TOC) content (C) in percent dry weight and of sediments from IODP Expedition 347. Sample depths are indicated in the space between panels B and C and correspond to the key in panel C. Values for salinity and TOC were collected and reported as part of IODP Expedition 347 (38).

