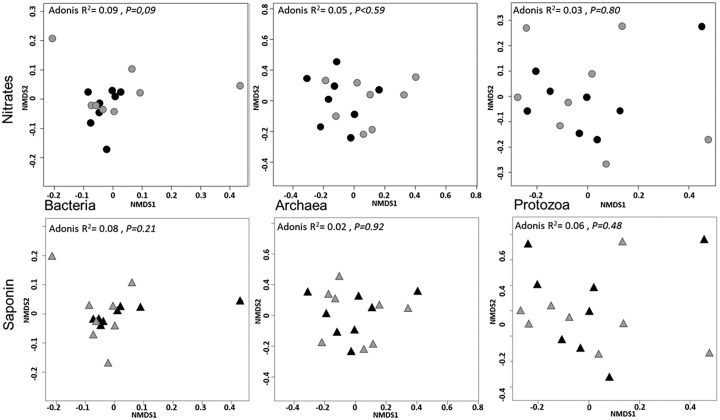
FIG 3.
Structure and composition of bacterial, archaeal, and protozoal communities in study 2, related to nitrate or saponin treatments (black symbols) and respective controls (gray symbols), were examined by multivariate analysis. NDMS plots derived from Bray-Curtis dissimilarities between cows are shown. Each symbol is representative of a single cow. Samples are plotted along the first two-component axes. Microbial composition was compared using Adonis.

