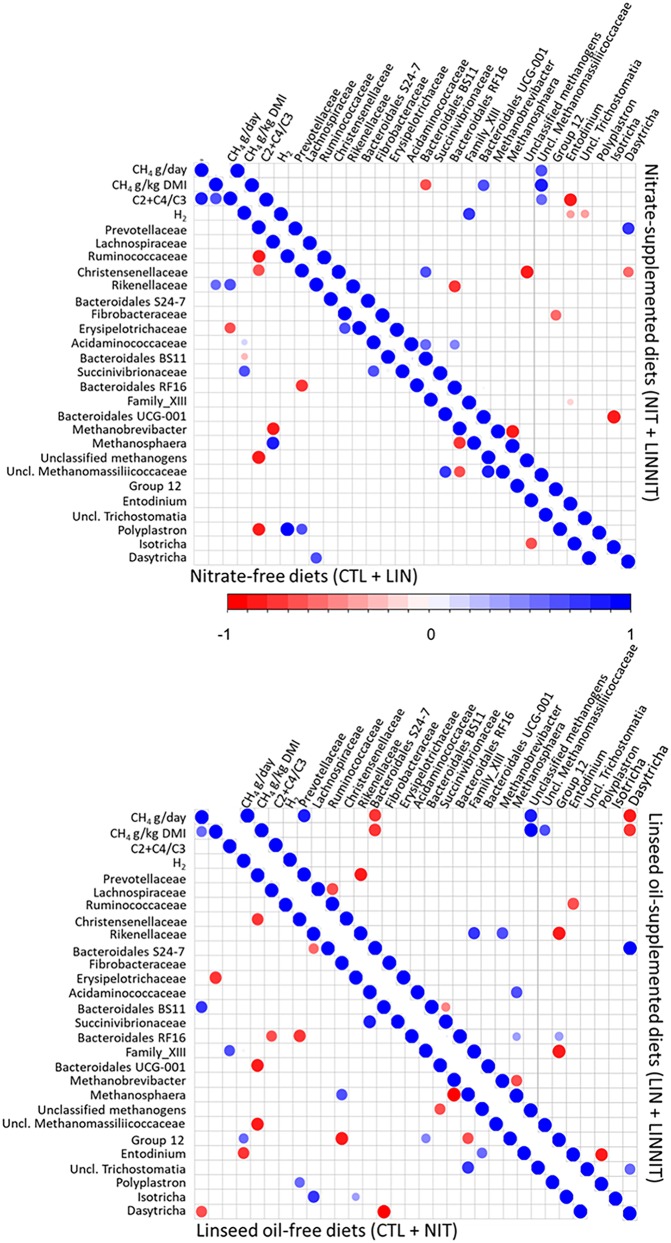
FIG 4.
Spearman’s rank correlation matrix of the dominant ruminal bacterial families, genera of archaea and protozoa, and fermentation parameters in study 1. Illustrated correlation patterns are for nitrate and linseed supplementations. Listed microbial populations were detected in at least 50% of the rumen samples analyzed and represent at least 1% of the bacterial, archaeal, protozoal, or fungal communities. Strong correlations are indicated by large circles, whereas weak correlations are indicated by small circles. The colors of the scale bar denote the nature of the correlation, with 1 indicating perfect positive correlation (dark blue) and −1 indicating perfect negative correlation (dark red) between two microbial populations.

