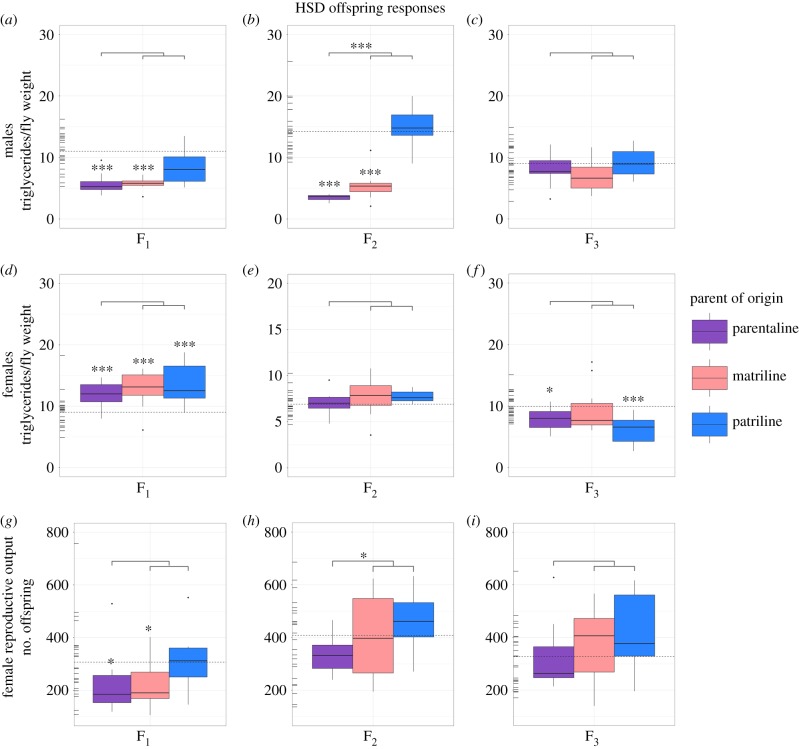
Figure 4.
Lineage-specific effects of ancestral HSD on male and female triglyceride levels and female reproductive output. Data show raw values of triglyceride levels in males (a–c) and females (d–f), as well as total counts of successfully eclosed offspring (g–i) of females deriving from an ancestral HSD parent-of-origin for three generations. Rug plots located on the left of each plot represent control values for each metabolite and generation displayed, where the mean control value is indicated by the horizontal dotted line. Significance levels were corrected experiment wide using false discovery rate corrections [44] and are represented by *** (0.001), ** (0.01), * (0.05). Notably, significant differences noted directly above individual boxplots denote differences between controls and a given lineage, whereas significance levels noted in the line above all three of the lineages denote phenotypic non-additivity between parentally transmitted responses and the sum of maternally and paternally transmitted responses.

