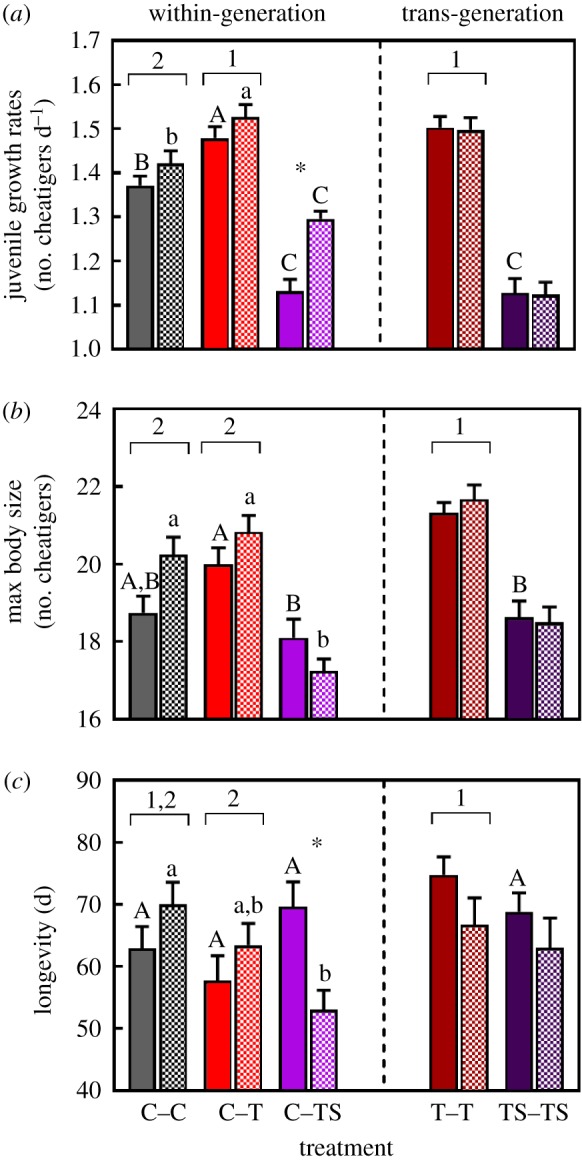
Figure 5.

Effects of within-generation and trans-generation exposure to elevated temperature (T) and elevated temperature combined with elevated salinity (TS) conditions on traits for which there was an interactive effect of ‘treatment’ and ‘transplant’. (a) Juvenile growth rates (n = 50–60 per treatment), (b) maximum body size (n = 10–12 per treatment) and (c) longevity (n = 10–12 per treatment) of O. labronica. Solid and hatched bars represent egg mass and juvenile transplants respectively. C = control conditions. Solid and hatched bars represent egg mass and juvenile transplants respectively. Bar chart represents mean values ± s.e. Capital and lower-case letters represent significant differences between egg mass and juvenile transplants, respectively, for within-generation treatments and for within- versus trans-generation TS comparisons. Numbers represent significant differences between within- versus trans-generation T treatments. Asterisk (*) represents a significant difference between egg mass and juvenile transplants within the same treatment.
