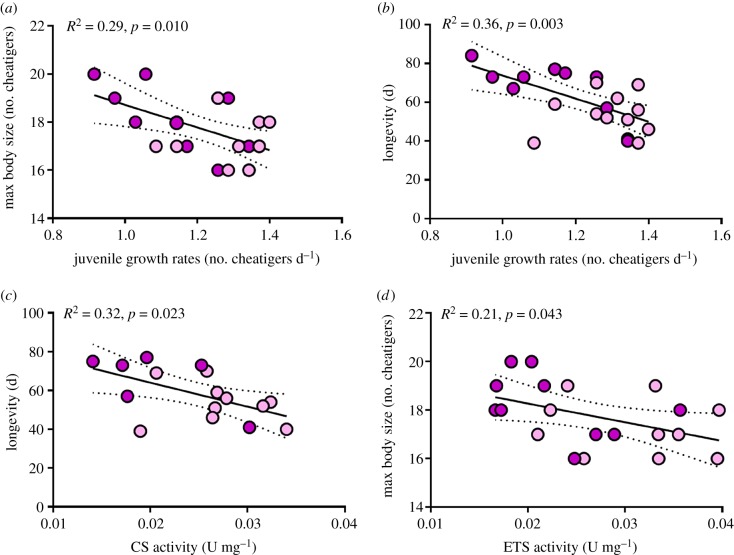
Figure 6.
Significant within-generation relationships between traits of O. labronica exposed to the control-elevated temperature combined with elevated salinity (C–TS) treatment. (a) Juvenile growth rates versus max body size, (b) juvenile growth rates versus longevity, (c) citrate synthase activity versus longevity and (d) electron transport system activity versus max body size. Dark and light colours represent egg mass and juvenile transplants, respectively. R2 and p-values are provided.

