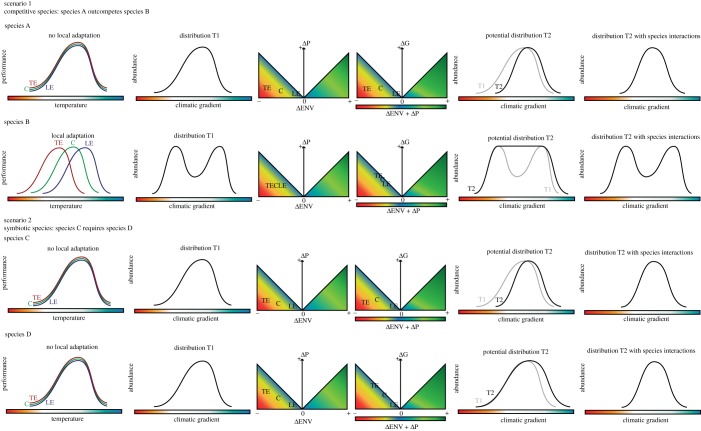
Figure 3.
Multispecies scenarios for example model use. In this figure, each row represents a species. The far left panels depict the current-day thermal performance of a species across the range sections (TE, trailing edge; C, core; LE, leading edge), followed by the current-day distribution at time 1. The middle two sections are the model visualization from figure 2 (colour scale blue is a neutral, green positive and red negative response). The right two panels depict the expected distribution at time 2. The first shows time 2 distribution without species interactions in black and the time 1 distribution in grey for comparison (second panel from the right). Finally, the far right panel shows time 2 distribution with species' interactions.

