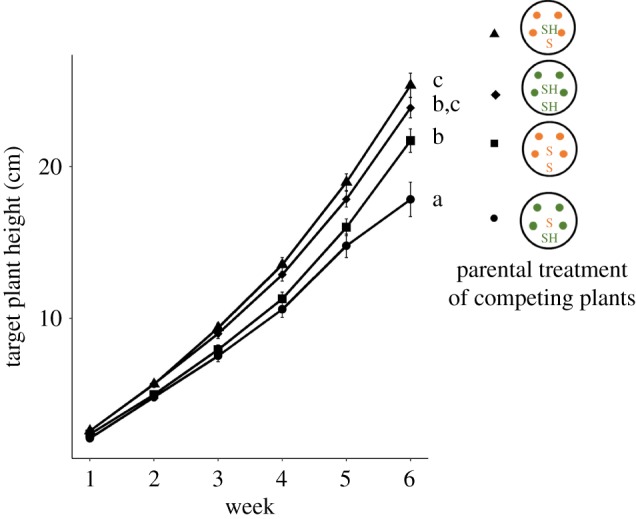
Figure 2.

Effects of parental light treatment on target plant height extension over time in competitive arrays. Means ± s.e for each type of array are shown (pooled across 5 genotypes); parental treatment of target and background plants (parental sun, S; parental shade, SH) labelled as in figure 1. Letters indicate significant differences based on post hoc Tukey's HSD tests (details in Methods). (Online version in colour.)
