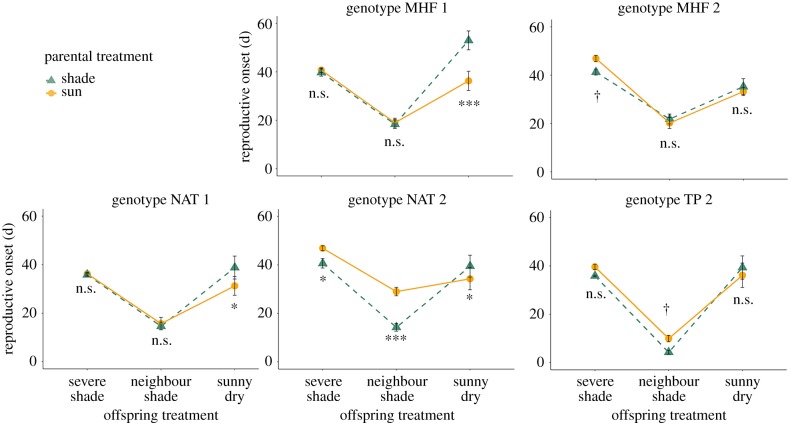
Figure 4.
Effects of parental sun versus parental shade on each genotype's time of reproductive onset in three contrasting offspring treatments. Means ± s.e. are shown. For each genotype, significance tests for the effect of parental shade versus parental sun within each offspring treatment are shown (simple effects tests; †p < 0.10, *p < 0.05, ***p < 0.001, non-significant (n.s.) p ≥ 0.10; details in Methods). (Online version in colour.)

