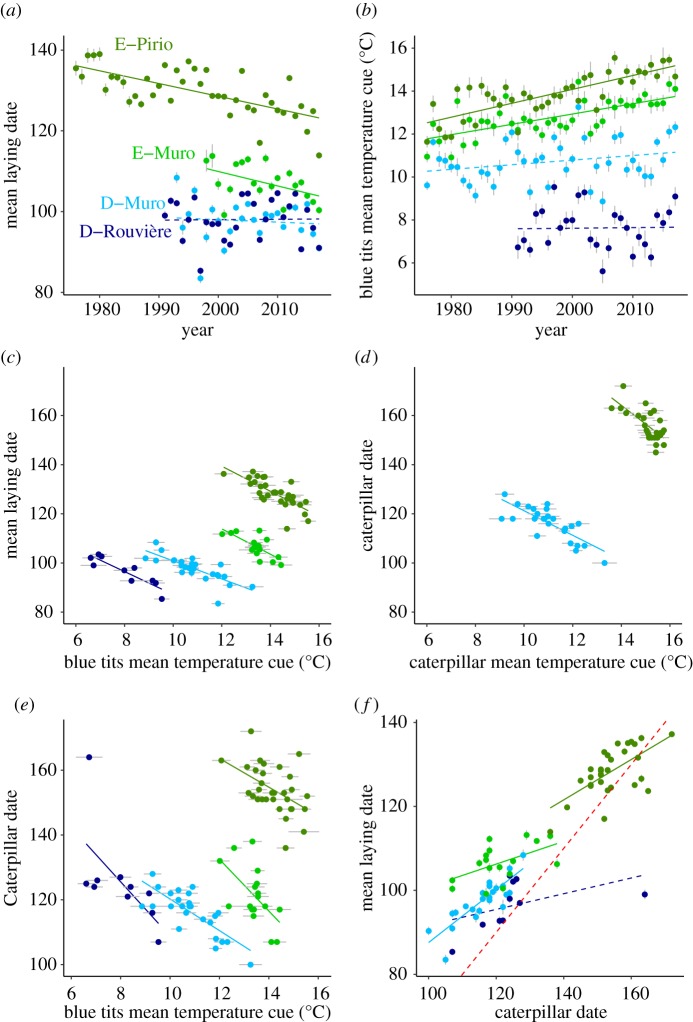
Figure 2.
(a) Temporal trends in annual mean laying dates in the four blue tit populations (mean ± s.e.); (b) temporal trends in mean temperature (in °C ± s.e.) for the cue windows used by each population; (c) blue tit reaction norms: annual mean laying date (±s.e.) as a function of the estimated cue (in °C ± s.e.); (d) caterpillar reaction norm (only for E-Pirio and D-Muro): annual caterpillar peak date as a function of the estimated cue (°C ± s.e.); (e) Cue reliability for blue tits measured as the correlation between the caterpillar peak date and the cue (electronic supplementary material, table S7); (f) Synchrony between blue tits and caterpillars illustrated as the correlation between mean laying date of blue tits (±s.e.) and caterpillar peak date (see electronic supplementary material, table S8). In all panels, the ‘Evergreen’ sites are in green (dark green for E-Pirio, light green for E-Muro), and ‘Deciduous’ sites are in blue (dark blue for D-Rouvière, light blue for D-Muro). All dates are ordinal dates with 1 = 1st January. In (f), the red dashed line represents the expected optimal relationship between laying date and caterpillar date. In some cases, error bars are not visible because they are very small compared to the figure scale.

