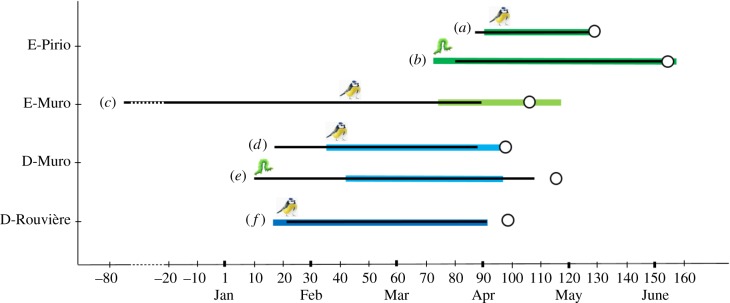
Figure 3.
Estimated mean temperature cue windows for blue tits (a,c,d,f) and caterpillars (b,e) in each population. The open circles represent the mean phenology (mean laying date or mean caterpillar peak date). The first and last days of the window are given in ordinal day, with 1 = 1st January. Coloured lines represent the best windows (from the best model, green for evergreen and blue for deciduous); black lines represent the median windows from the 95% confidence set (see electronic supplementary material, Box S2 and [72,73]). A good agreement between best and median window is an indicator that the window is precisely estimated.

