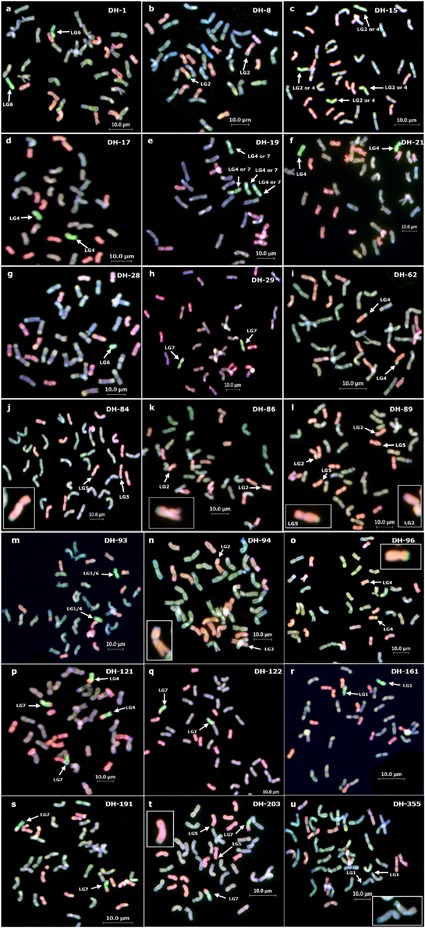
FIGURE 2.

GISH analysis of DH lines showing the different segments present. (a) DH-1 (b) DH-8 (c) DH-15 (d) DH-17 (e) DH-19 (f) DH-21 (g) DH-28 (h) DH-29 (i) DH-62 (j) DH-84 (k) DH-86 (l) DH-89 (m) DH-93 (n) DH-94 (o) DH-96 (p) DH-121 (q) DH-122 (r) DH-161 (s) DH-191 (t) DH-203 (u) DH-355. All GISH was carried out using four colors as indicated in Materials and Methods, but all photos shown were taken using three colors with a green filter for Alexa Fluor 546 for best visualization of the Am. muticum segments (bright green segment indicated with white arrows). The A and B genome chromosomes are colored the same (blue/light green) under this color capture. The D genome is shown in red. Small segments are also shown as enlargements.
