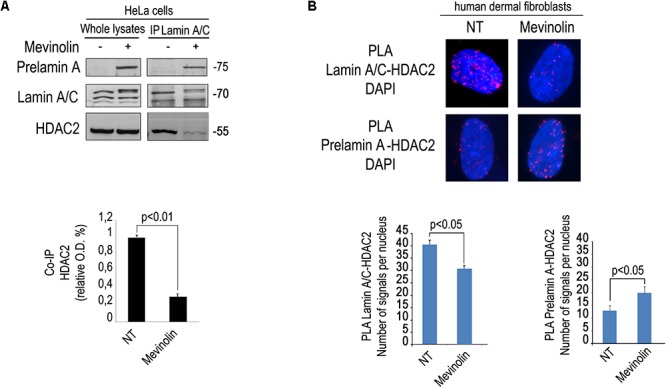
Figure 1.

Modulation of lamin A/C-HDAC2 interaction by statins. (A) Co-immunoprecipitation of lamin A/C and HDAC2 in the presence or absence of mevinolin as indicated in the legend. A representative western blot is shown. Molecular weight markers are indicated in kDa. Densitometric analysis of immunoprecipitated HDAC2 bands is reported in the graph. Statistical significance (p < 0.01) is indicated. (B) PLA of lamin A/C and HDAC2 or prelamin A and HDAC2 in human dermal fibroblasts left untreated (NT) or treated with mevinolin (Mevinolin). Nuclei are counterstained with DAPI. Quantitative analysis of PLA signals (red dots) is reported in the graphs. Statistical significance (p < 0.05) is indicated.
